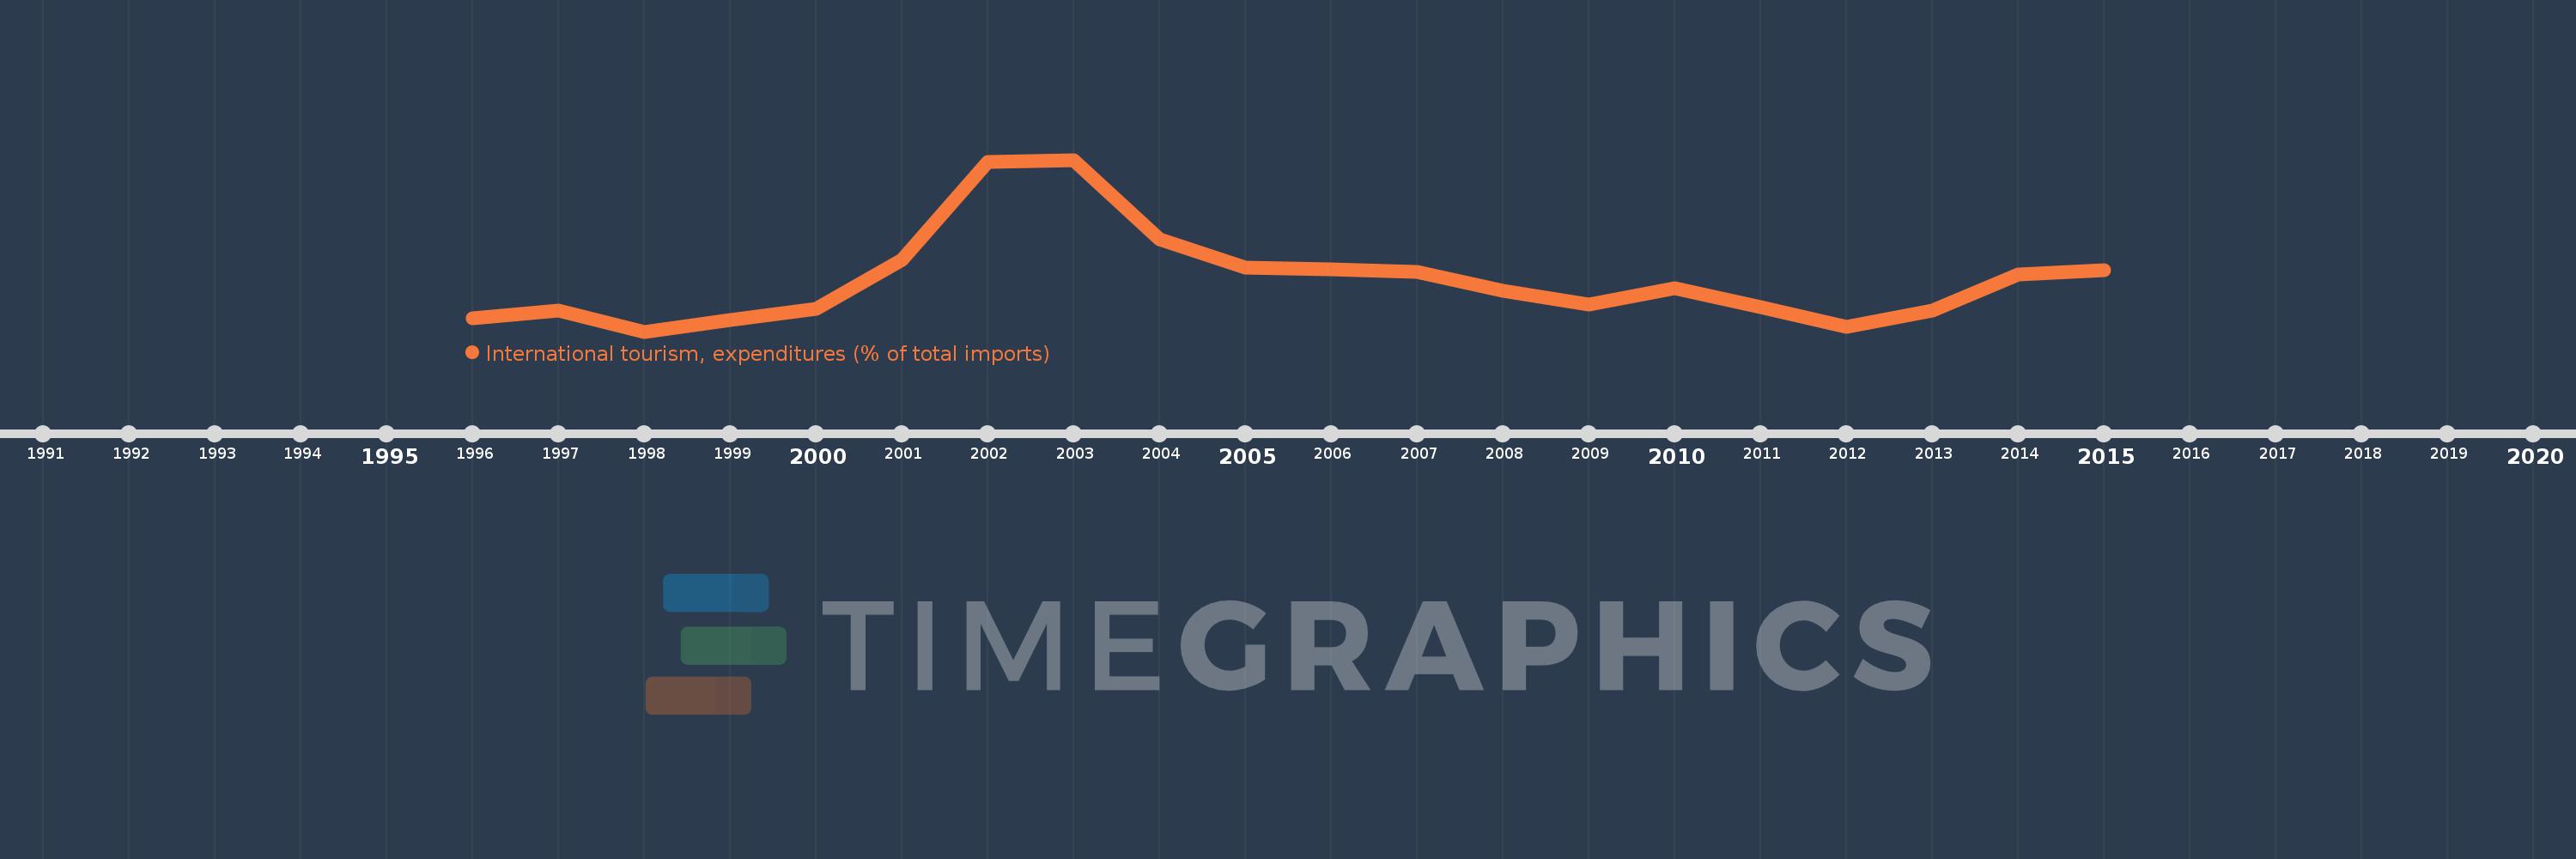
Questa scala temporale mostra un grafico dal 1996 anno al 2015 anno. Belarus. I dati fino ad 1995 anno non disponibili. Il numero di osservazioni attuali secondo i date: 20.
La fonte (nome):
Indicatori dello sviluppo mondiale
La fonte (organizzazione):
World Tourism Organization, Yearbook of Tourism Statistics, Compendium of Tourism Statistics and data files, and IMF and World Bank imports estimates.
Categorie:
Private Sector, Trade
sono stati aggiornati
23 apr 2017 anni
Indicatori delle variazioni dei valori per anni
In media:
2.737
Minima:
1.404
1 gen 1998 anni
Massimo:
5.805
1 gen 2003 anni
Alla data di osservazione
Valore
Variazione assoluta
La variazione rispetto al valore precedente
1 gen 1996 anni
1.756
+1.756
0.0%
1 gen 1997 anni
1.952
+0.196
11.18%
1 gen 1998 anni
1.404
-0.548
-28.08%
1 gen 1999 anni
1.7
+0.296
21.11%
1 gen 2000 anni
1.998
+0.298
17.54%
1 gen 2001 anni
3.244
+1.245
62.31%
1 gen 2002 anni
5.74
+2.496
76.96%
1 gen 2003 anni
5.805
+0.065
1.14%
1 gen 2004 anni
3.767
-2.038
-35.11%
1 gen 2005 anni
3.036
-0.731
-19.42%
1 gen 2006 anni
3.001
-0.035
-1.14%
1 gen 2007 anni
2.927
-0.074
-2.46%
1 gen 2008 anni
2.44
-0.487
-16.63%
1 gen 2009 anni
2.104
-0.336
-13.77%
1 gen 2010 anni
2.514
+0.409
19.45%
1 gen 2011 anni
2.033
-0.481
-19.14%
1 gen 2012 anni
1.527
-0.506
-24.88%
1 gen 2013 anni
1.933
+0.406
26.58%
1 gen 2014 anni
2.874
+0.941
48.69%
1 gen 2015 anni
2.987
+0.113
3.94%
Classificazione dei paesi secondo i statistiche attuali per anni