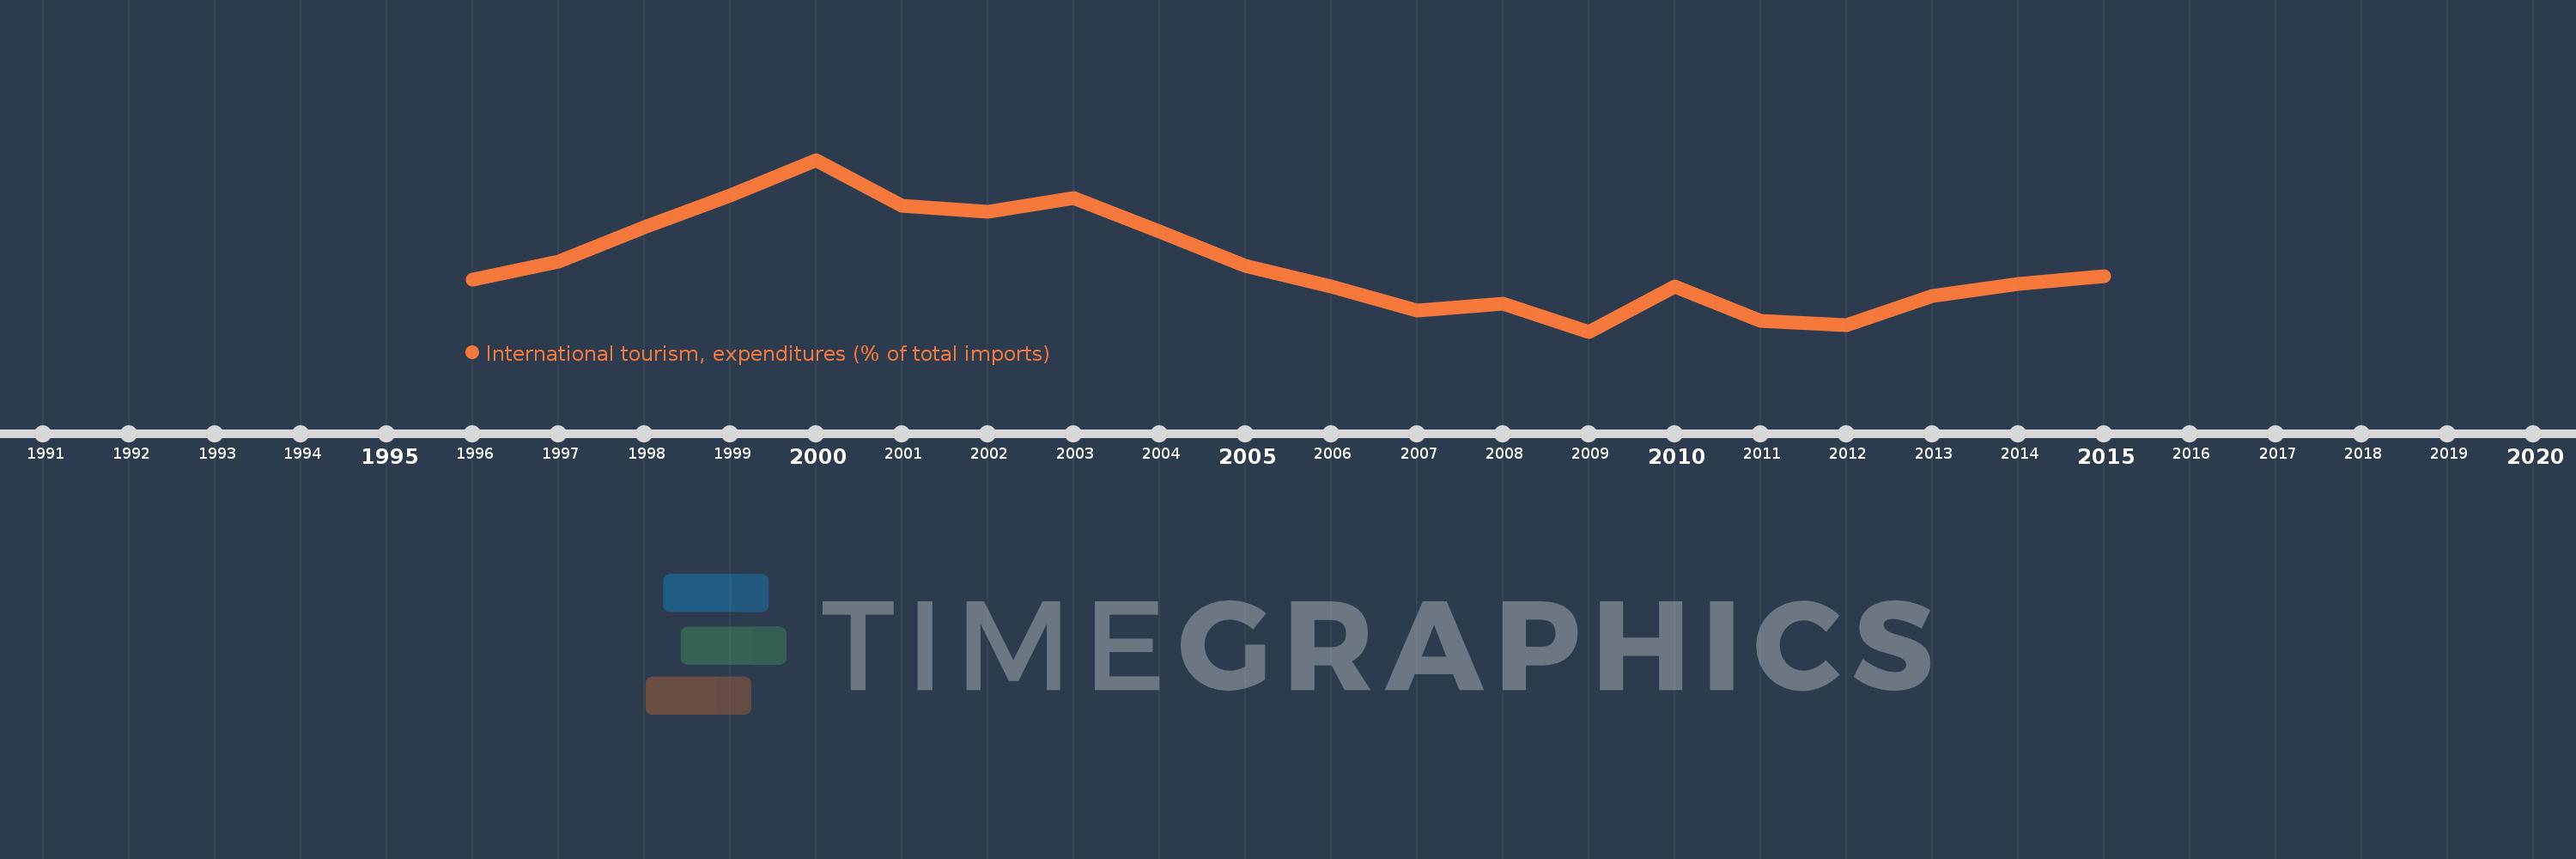
Questa scala temporale mostra un grafico dal 1996 anno al 2015 anno. Paraguay. I dati fino ad 1995 anno non disponibili. Il numero di osservazioni attuali secondo i date: 20.
La fonte (nome):
Indicatori dello sviluppo mondiale
La fonte (organizzazione):
World Tourism Organization, Yearbook of Tourism Statistics, Compendium of Tourism Statistics and data files, and IMF and World Bank imports estimates.
Categorie:
Private Sector, Trade
sono stati aggiornati
23 apr 2017 anni
Indicatori delle variazioni dei valori per anni
In media:
3.71
Minima:
2.315
1 gen 2009 anni
Massimo:
5.807
1 gen 2000 anni
Alla data di osservazione
Valore
Variazione assoluta
La variazione rispetto al valore precedente
1 gen 1996 anni
3.373
+3.373
0.0%
1 gen 1997 anni
3.737
+0.364
10.78%
1 gen 1998 anni
4.442
+0.705
18.86%
1 gen 1999 anni
5.078
+0.636
14.32%
1 gen 2000 anni
5.807
+0.729
14.35%
1 gen 2001 anni
4.873
-0.934
-16.08%
1 gen 2002 anni
4.745
-0.128
-2.62%
1 gen 2003 anni
5.022
+0.276
5.82%
1 gen 2004 anni
4.343
-0.679
-13.51%
1 gen 2005 anni
3.646
-0.697
-16.05%
1 gen 2006 anni
3.229
-0.417
-11.44%
1 gen 2007 anni
2.75
-0.479
-14.84%
1 gen 2008 anni
2.874
+0.125
4.54%
1 gen 2009 anni
2.315
-0.559
-19.45%
1 gen 2010 anni
3.233
+0.918
39.65%
1 gen 2011 anni
2.536
-0.697
-21.57%
1 gen 2012 anni
2.439
-0.097
-3.81%
1 gen 2013 anni
3.04
+0.601
24.62%
1 gen 2014 anni
3.287
+0.247
8.13%
1 gen 2015 anni
3.439
+0.152
4.63%
Classificazione dei paesi secondo i statistiche attuali per anni