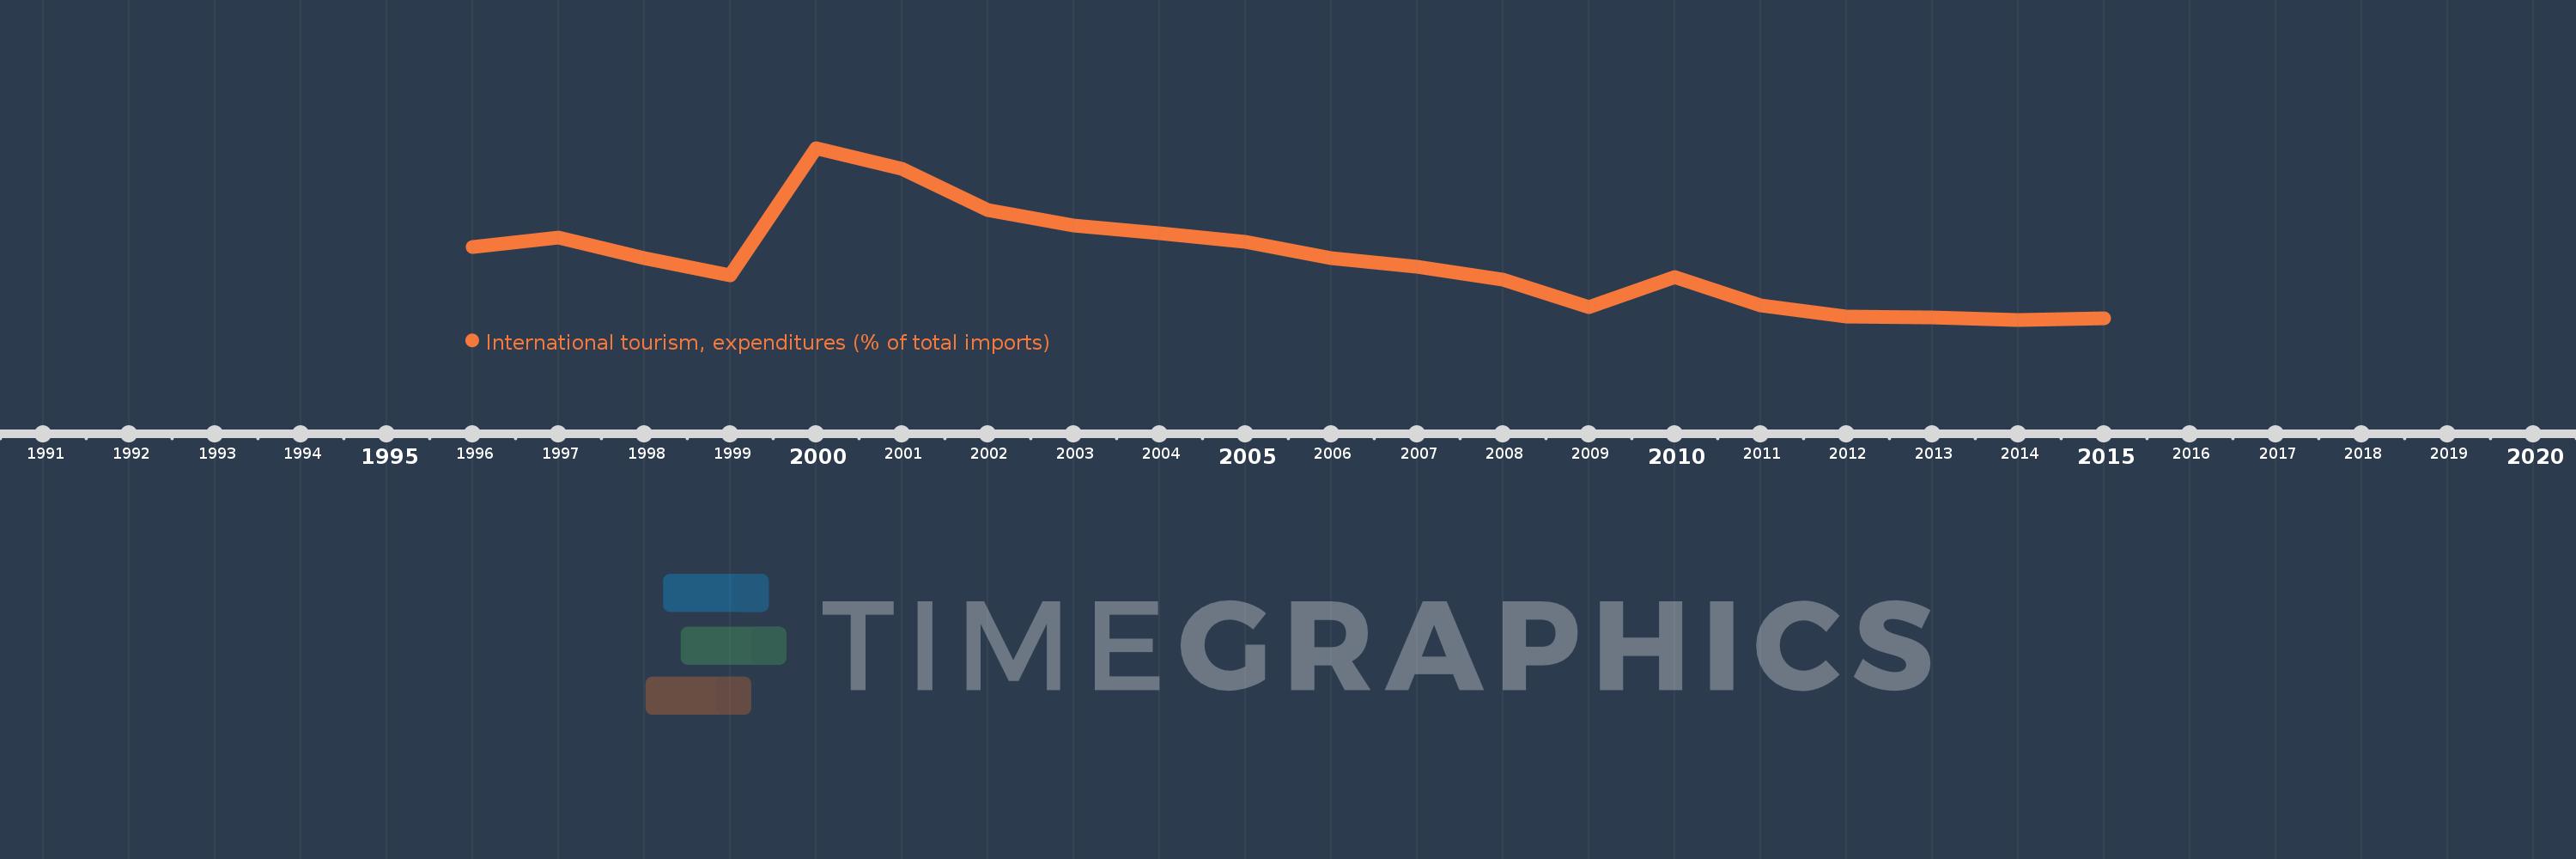
Questa scala temporale mostra un grafico dal 1996 anno al 2015 anno. Ecuador. I dati fino ad 1995 anno non disponibili. Il numero di osservazioni attuali secondo i date: 20.
La fonte (nome):
Indicatori dello sviluppo mondiale
La fonte (organizzazione):
World Tourism Organization, Yearbook of Tourism Statistics, Compendium of Tourism Statistics and data files, and IMF and World Bank imports estimates.
Categorie:
Private Sector, Trade
sono stati aggiornati
23 apr 2017 anni
Indicatori delle variazioni dei valori per anni
In media:
5.339
Minima:
3.337
1 gen 2014 anni
Massimo:
9.148
1 gen 2000 anni
Alla data di osservazione
Valore
Variazione assoluta
La variazione rispetto al valore precedente
1 gen 1996 anni
5.799
+5.799
0.0%
1 gen 1997 anni
6.115
+0.316
5.45%
1 gen 1998 anni
5.427
-0.688
-11.24%
1 gen 1999 anni
4.851
-0.576
-10.62%
1 gen 2000 anni
9.148
+4.297
88.57%
1 gen 2001 anni
8.444
-0.704
-7.7%
1 gen 2002 anni
7.033
-1.411
-16.71%
1 gen 2003 anni
6.534
-0.499
-7.1%
1 gen 2004 anni
6.257
-0.277
-4.23%
1 gen 2005 anni
5.978
-0.279
-4.45%
1 gen 2006 anni
5.434
-0.544
-9.11%
1 gen 2007 anni
5.135
-0.299
-5.5%
1 gen 2008 anni
4.693
-0.442
-8.6%
1 gen 2009 anni
3.775
-0.918
-19.55%
1 gen 2010 anni
4.773
+0.998
26.42%
1 gen 2011 anni
3.813
-0.96
-20.12%
1 gen 2012 anni
3.456
-0.357
-9.36%
1 gen 2013 anni
3.406
-0.05
-1.45%
1 gen 2014 anni
3.337
-0.069
-2.02%
1 gen 2015 anni
3.379
+0.042
1.26%
Classificazione dei paesi secondo i statistiche attuali per anni