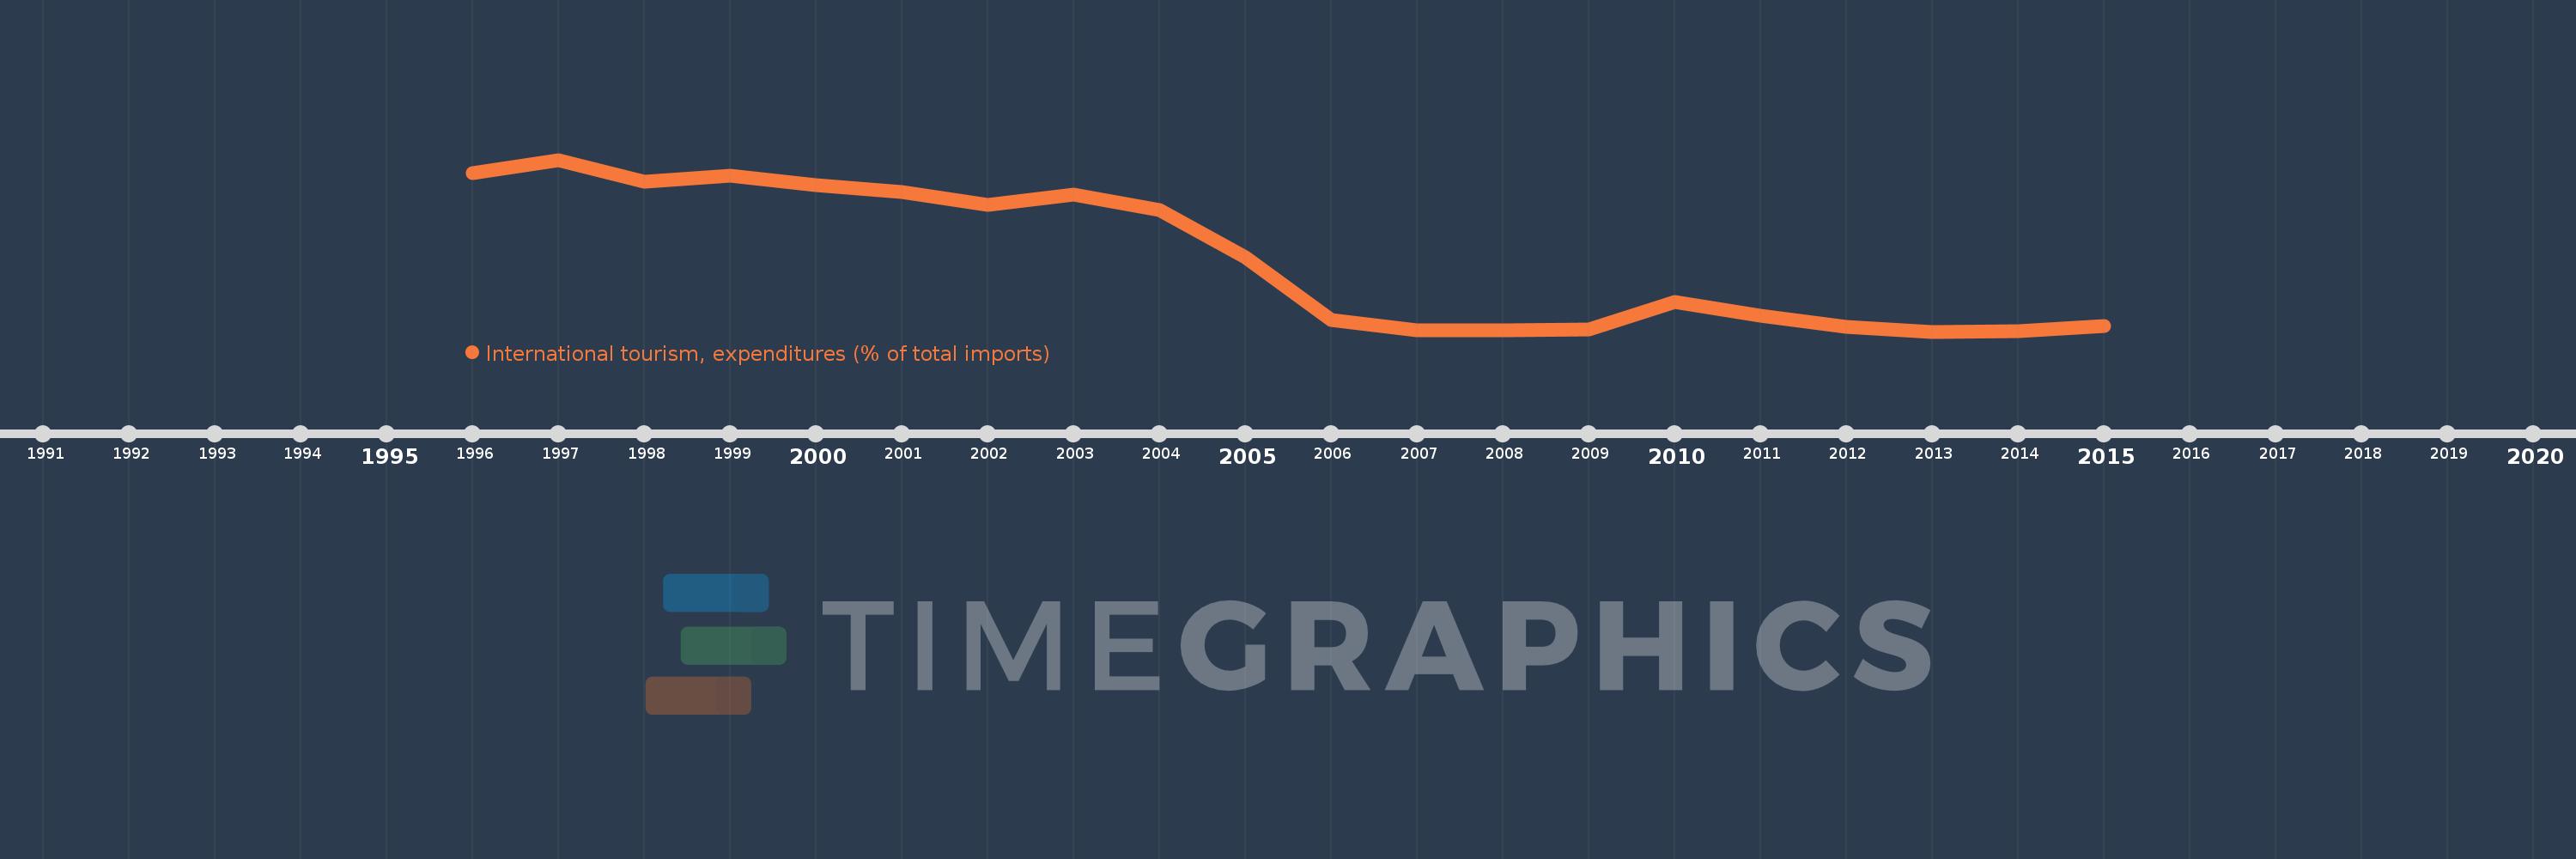
Questa scala temporale mostra un grafico dal 1996 anno al 2015 anno. Netherlands. I dati fino ad 1995 anno non disponibili. Il numero di osservazioni attuali secondo i date: 20.
La fonte (nome):
Indicatori dello sviluppo mondiale
La fonte (organizzazione):
World Tourism Organization, Yearbook of Tourism Statistics, Compendium of Tourism Statistics and data files, and IMF and World Bank imports estimates.
Categorie:
Private Sector, Trade
sono stati aggiornati
23 apr 2017 anni
Indicatori delle variazioni dei valori per anni
In media:
4.645
Minima:
3.281
1 gen 2013 anni
Massimo:
6.5
1 gen 1997 anni
Alla data di osservazione
Valore
Variazione assoluta
La variazione rispetto al valore precedente
1 gen 1996 anni
6.258
+6.258
0.0%
1 gen 1997 anni
6.5
+0.242
3.87%
1 gen 1998 anni
6.082
-0.418
-6.43%
1 gen 1999 anni
6.204
+0.123
2.02%
1 gen 2000 anni
6.027
-0.178
-2.86%
1 gen 2001 anni
5.899
-0.127
-2.11%
1 gen 2002 anni
5.656
-0.243
-4.13%
1 gen 2003 anni
5.854
+0.198
3.5%
1 gen 2004 anni
5.551
-0.303
-5.17%
1 gen 2005 anni
4.668
-0.883
-15.91%
1 gen 2006 anni
3.502
-1.167
-24.99%
1 gen 2007 anni
3.31
-0.192
-5.48%
1 gen 2008 anni
3.313
+0.003
0.1%
1 gen 2009 anni
3.326
+0.013
0.4%
1 gen 2010 anni
3.835
+0.509
15.29%
1 gen 2011 anni
3.578
-0.256
-6.68%
1 gen 2012 anni
3.37
-0.209
-5.83%
1 gen 2013 anni
3.281
-0.089
-2.63%
1 gen 2014 anni
3.292
+0.011
0.34%
1 gen 2015 anni
3.386
+0.094
2.85%
Classificazione dei paesi secondo i statistiche attuali per anni