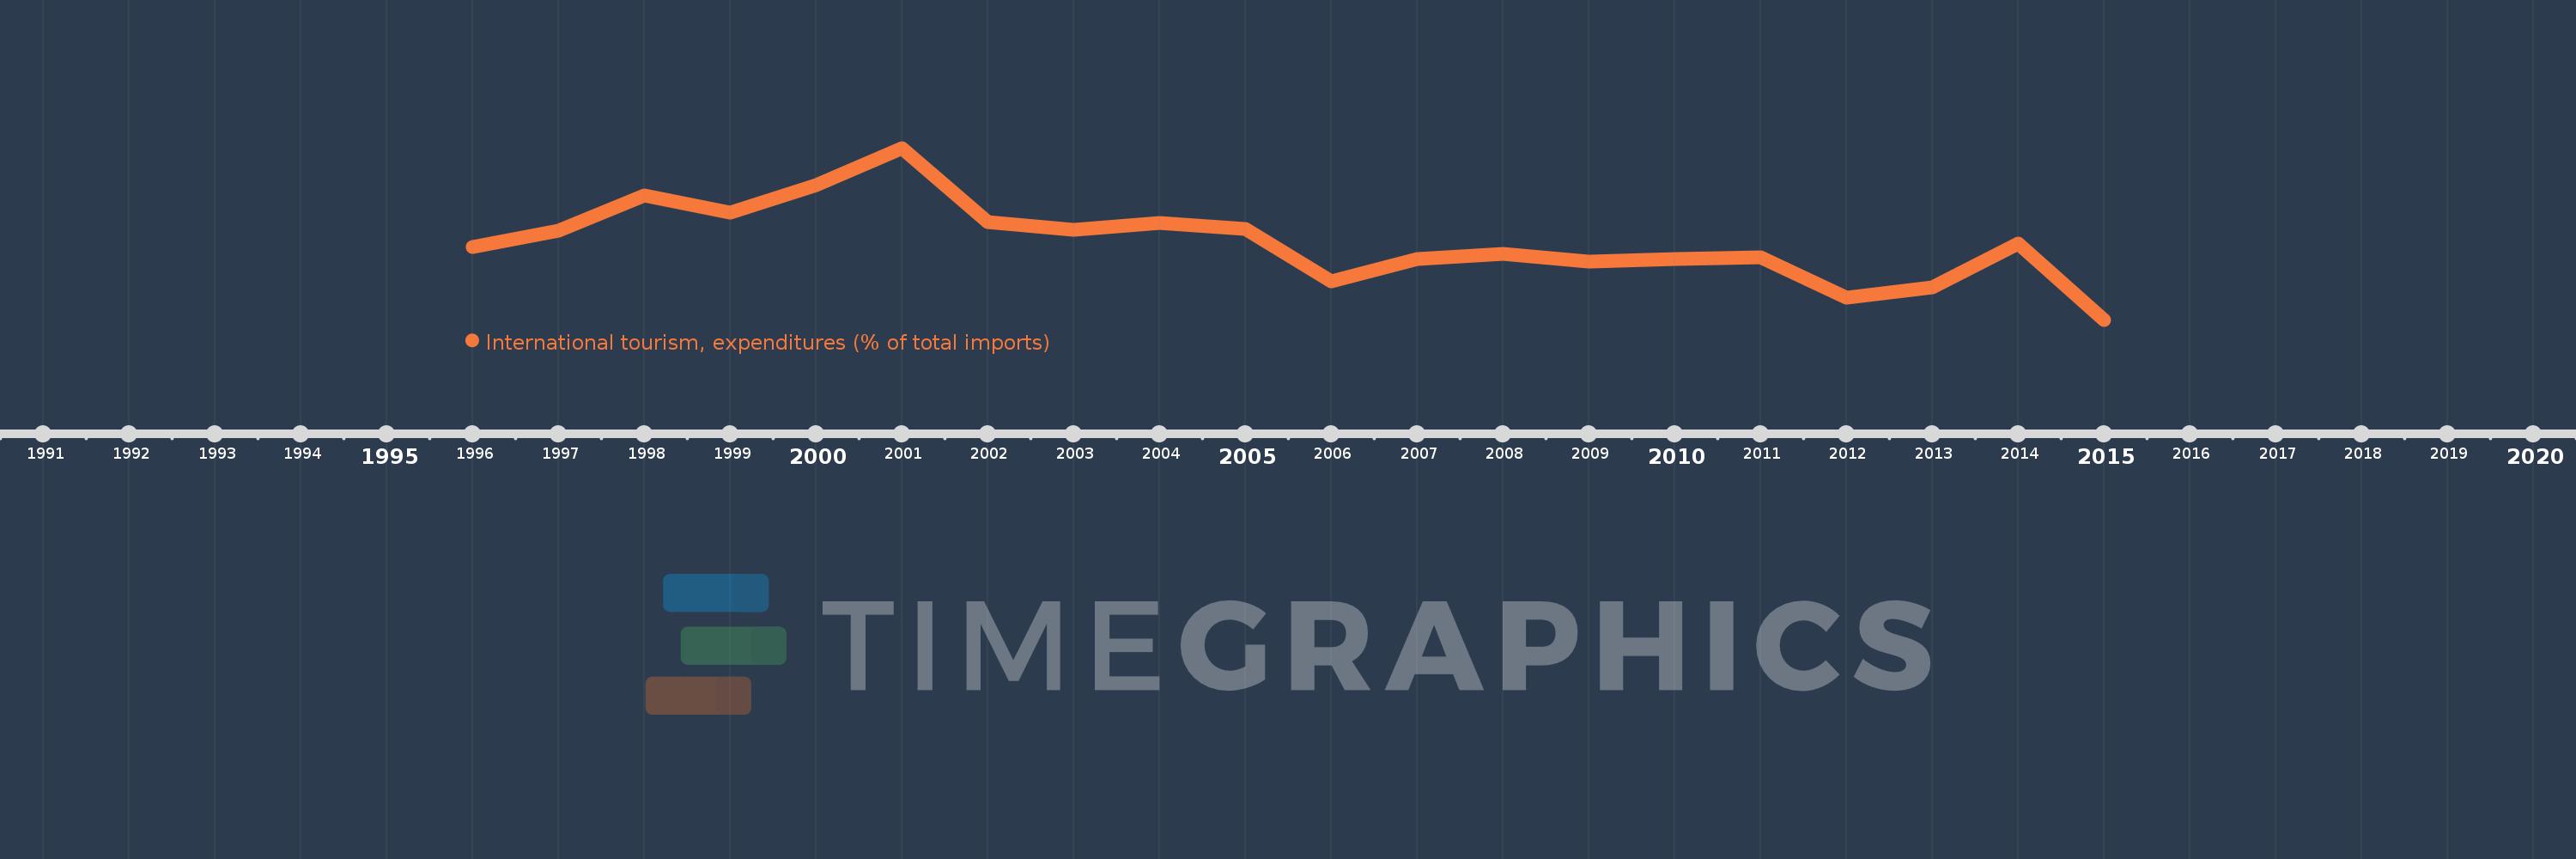
Questa scala temporale mostra un grafico dal 1996 anno al 2015 anno. Bangladesh. I dati fino ad 1995 anno non disponibili. Il numero di osservazioni attuali secondo i date: 20.
La fonte (nome):
Indicatori dello sviluppo mondiale
La fonte (organizzazione):
World Tourism Organization, Yearbook of Tourism Statistics, Compendium of Tourism Statistics and data files, and IMF and World Bank imports estimates.
Categorie:
Private Sector, Trade
sono stati aggiornati
23 apr 2017 anni
Indicatori delle variazioni dei valori per anni
In media:
3.167
Minima:
1.762
1 gen 2015 anni
Massimo:
4.869
1 gen 2001 anni
Alla data di osservazione
Valore
Variazione assoluta
La variazione rispetto al valore precedente
1 gen 1996 anni
3.084
+3.084
0.0%
1 gen 1997 anni
3.369
+0.285
9.25%
1 gen 1998 anni
4.008
+0.639
18.97%
1 gen 1999 anni
3.697
-0.311
-7.76%
1 gen 2000 anni
4.198
+0.501
13.56%
1 gen 2001 anni
4.869
+0.671
15.98%
1 gen 2002 anni
3.532
-1.337
-27.46%
1 gen 2003 anni
3.388
-0.144
-4.07%
1 gen 2004 anni
3.514
+0.126
3.71%
1 gen 2005 anni
3.407
-0.107
-3.04%
1 gen 2006 anni
2.464
-0.943
-27.68%
1 gen 2007 anni
2.866
+0.402
16.3%
1 gen 2008 anni
2.956
+0.09
3.15%
1 gen 2009 anni
2.813
-0.143
-4.83%
1 gen 2010 anni
2.865
+0.052
1.84%
1 gen 2011 anni
2.891
+0.026
0.91%
1 gen 2012 anni
2.162
-0.729
-25.21%
1 gen 2013 anni
2.355
+0.193
8.92%
1 gen 2014 anni
3.147
+0.792
33.61%
1 gen 2015 anni
1.762
-1.385
-44.0%
Classificazione dei paesi secondo i statistiche attuali per anni