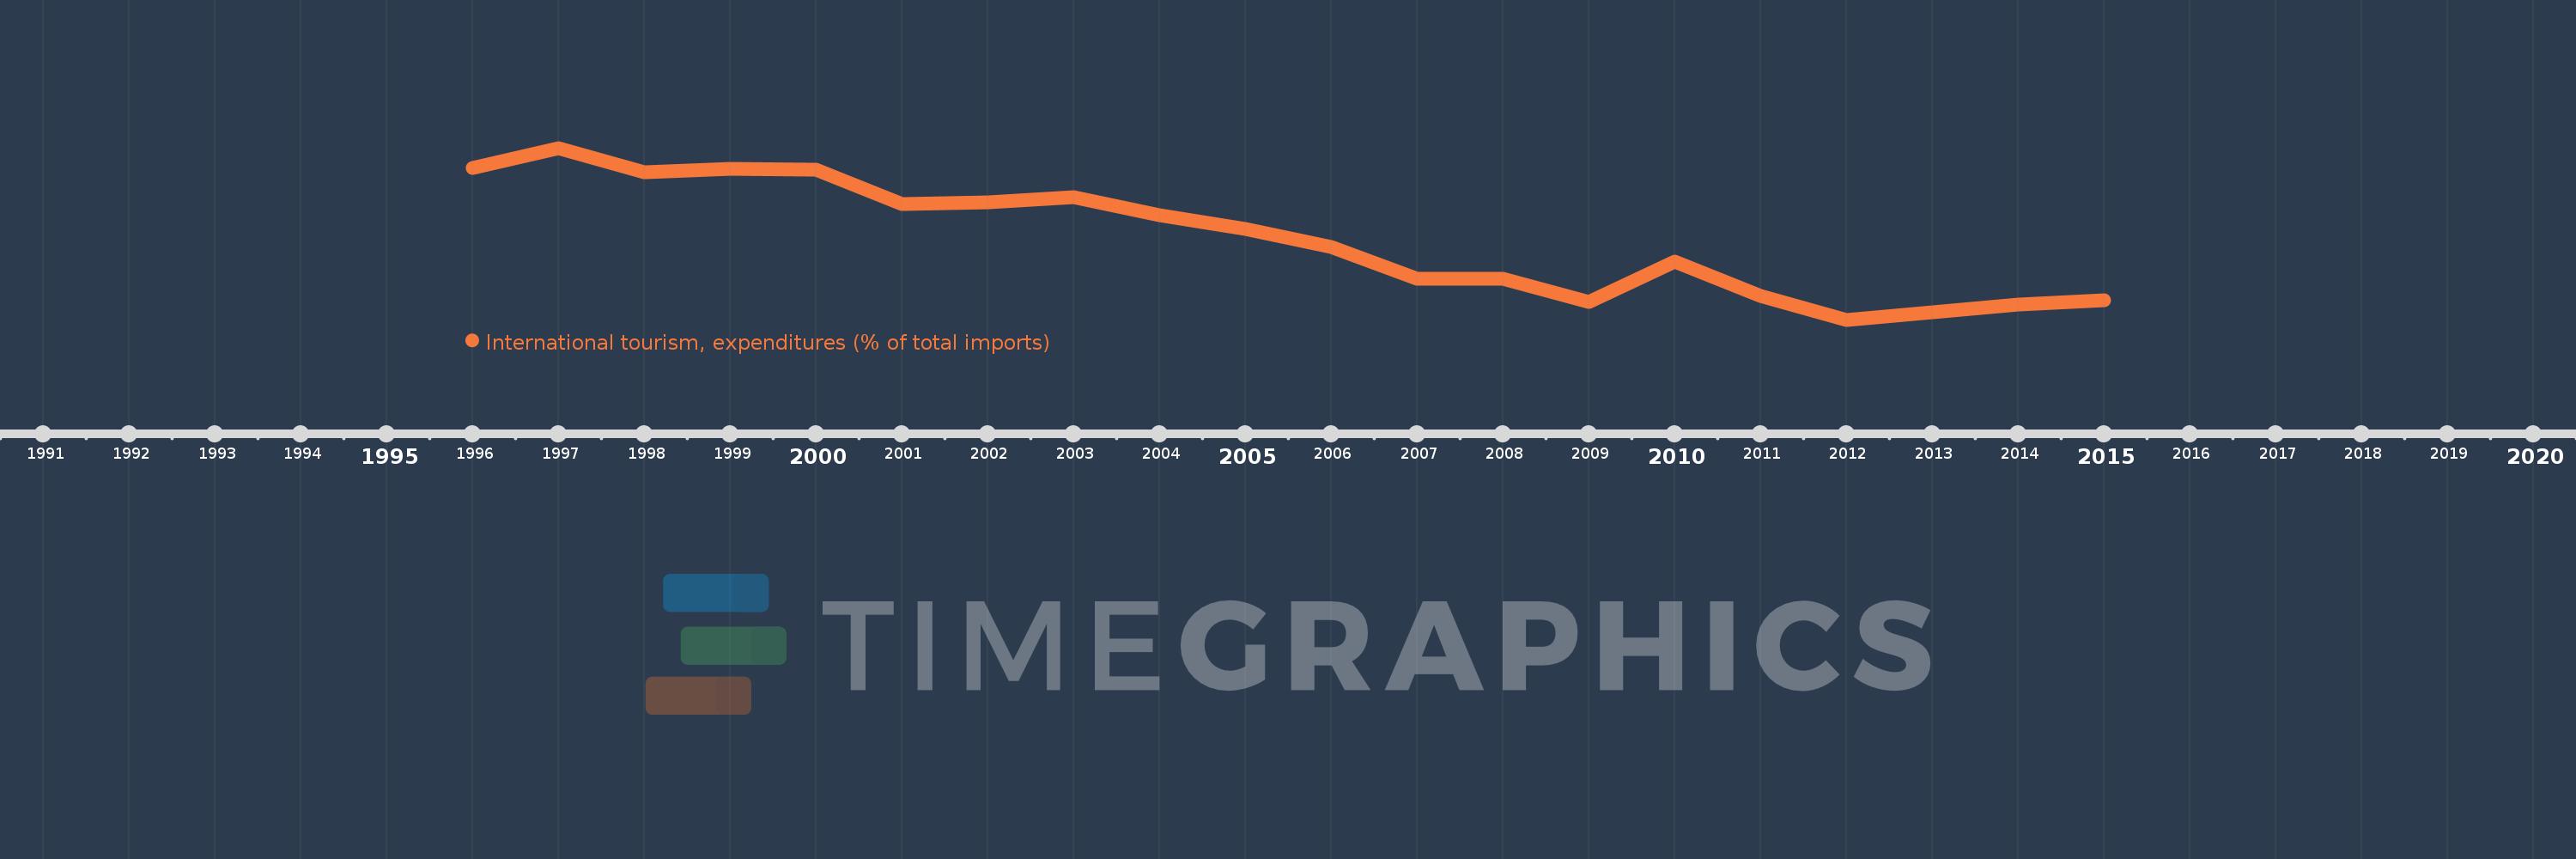
Questa scala temporale mostra un grafico dal 1996 anno al 2015 anno. High income. I dati fino ad 1995 anno non disponibili. Il numero di osservazioni attuali secondo i date: 20.
La fonte (nome):
Indicatori dello sviluppo mondiale
La fonte (organizzazione):
World Tourism Organization, Yearbook of Tourism Statistics, Compendium of Tourism Statistics and data files, and IMF and World Bank imports estimates.
Categorie:
Private Sector, Trade
sono stati aggiornati
23 apr 2017 anni
Indicatori delle variazioni dei valori per anni
In media:
6.571
Minima:
5.299
1 gen 2012 anni
Massimo:
7.999
1 gen 1997 anni
Alla data di osservazione
Valore
Variazione assoluta
La variazione rispetto al valore precedente
1 gen 1996 anni
7.682
+7.682
0.0%
1 gen 1997 anni
7.999
+0.317
4.13%
1 gen 1998 anni
7.613
-0.385
-4.82%
1 gen 1999 anni
7.676
+0.062
0.82%
1 gen 2000 anni
7.653
-0.022
-0.29%
1 gen 2001 anni
7.121
-0.532
-6.96%
1 gen 2002 anni
7.144
+0.023
0.32%
1 gen 2003 anni
7.225
+0.081
1.14%
1 gen 2004 anni
6.937
-0.288
-3.99%
1 gen 2005 anni
6.723
-0.214
-3.08%
1 gen 2006 anni
6.441
-0.283
-4.2%
1 gen 2007 anni
5.937
-0.503
-7.81%
1 gen 2008 anni
5.943
+0.006
0.11%
1 gen 2009 anni
5.575
-0.368
-6.19%
1 gen 2010 anni
6.217
+0.642
11.51%
1 gen 2011 anni
5.671
-0.546
-8.79%
1 gen 2012 anni
5.299
-0.372
-6.56%
1 gen 2013 anni
5.422
+0.124
2.33%
1 gen 2014 anni
5.54
+0.118
2.17%
1 gen 2015 anni
5.608
+0.068
1.23%
Classificazione dei paesi secondo i statistiche attuali per anni