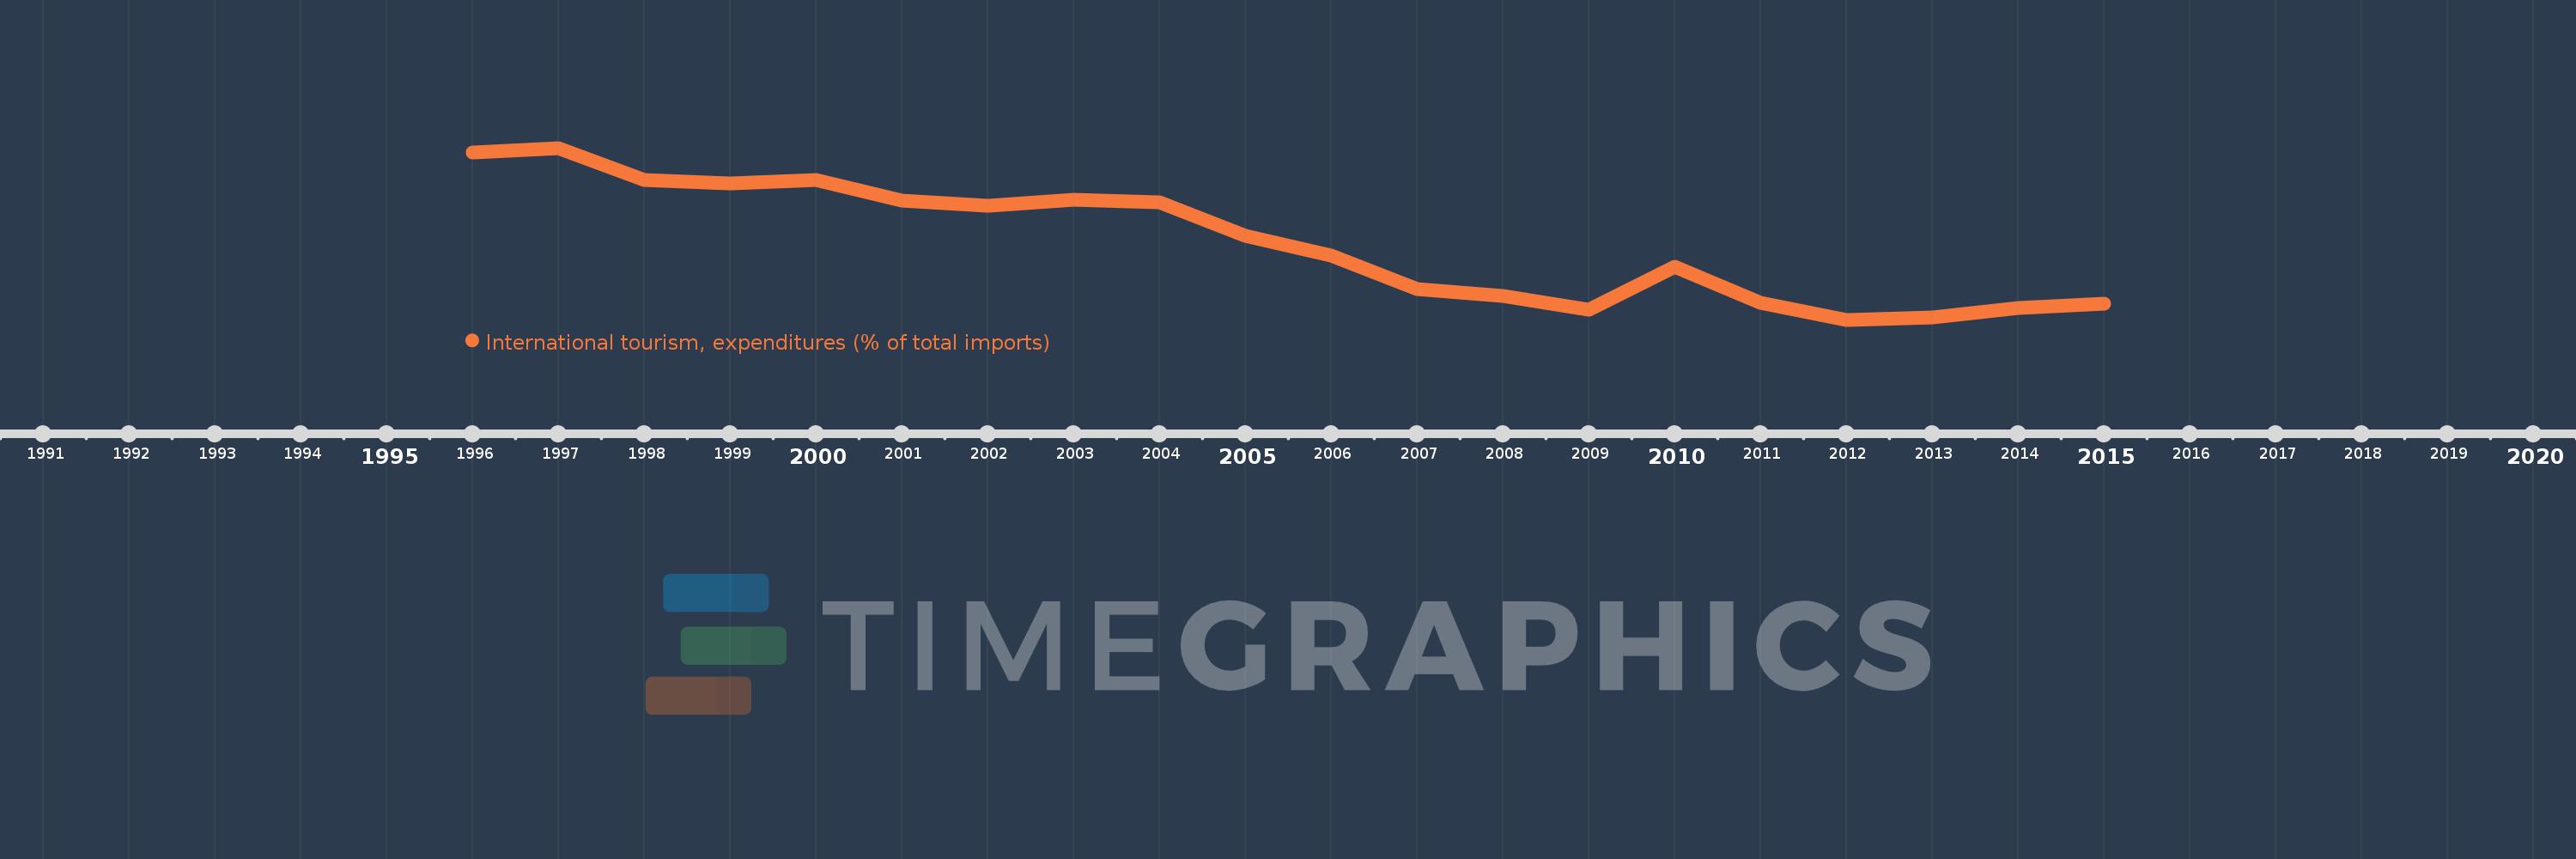
Questa scala temporale mostra un grafico dal 1996 anno al 2015 anno. Euro area. I dati fino ad 1995 anno non disponibili. Il numero di osservazioni attuali secondo i date: 20.
La fonte (nome):
Indicatori dello sviluppo mondiale
La fonte (organizzazione):
World Tourism Organization, Yearbook of Tourism Statistics, Compendium of Tourism Statistics and data files, and IMF and World Bank imports estimates.
Categorie:
Private Sector, Trade
sono stati aggiornati
23 apr 2017 anni
Indicatori delle variazioni dei valori per anni
In media:
6.567
Minima:
5.21
1 gen 2012 anni
Massimo:
8.237
1 gen 1997 anni
Alla data di osservazione
Valore
Variazione assoluta
La variazione rispetto al valore precedente
1 gen 1996 anni
8.16
+8.16
0.0%
1 gen 1997 anni
8.237
+0.077
0.94%
1 gen 1998 anni
7.68
-0.557
-6.76%
1 gen 1999 anni
7.616
-0.064
-0.83%
1 gen 2000 anni
7.667
+0.051
0.67%
1 gen 2001 anni
7.31
-0.357
-4.66%
1 gen 2002 anni
7.225
-0.085
-1.16%
1 gen 2003 anni
7.319
+0.094
1.3%
1 gen 2004 anni
7.281
-0.037
-0.51%
1 gen 2005 anni
6.684
-0.597
-8.2%
1 gen 2006 anni
6.339
-0.345
-5.16%
1 gen 2007 anni
5.755
-0.584
-9.22%
1 gen 2008 anni
5.633
-0.123
-2.13%
1 gen 2009 anni
5.39
-0.243
-4.31%
1 gen 2010 anni
6.147
+0.757
14.05%
1 gen 2011 anni
5.508
-0.639
-10.39%
1 gen 2012 anni
5.21
-0.298
-5.41%
1 gen 2013 anni
5.253
+0.043
0.83%
1 gen 2014 anni
5.421
+0.168
3.19%
1 gen 2015 anni
5.499
+0.078
1.44%
Classificazione dei paesi secondo i statistiche attuali per anni