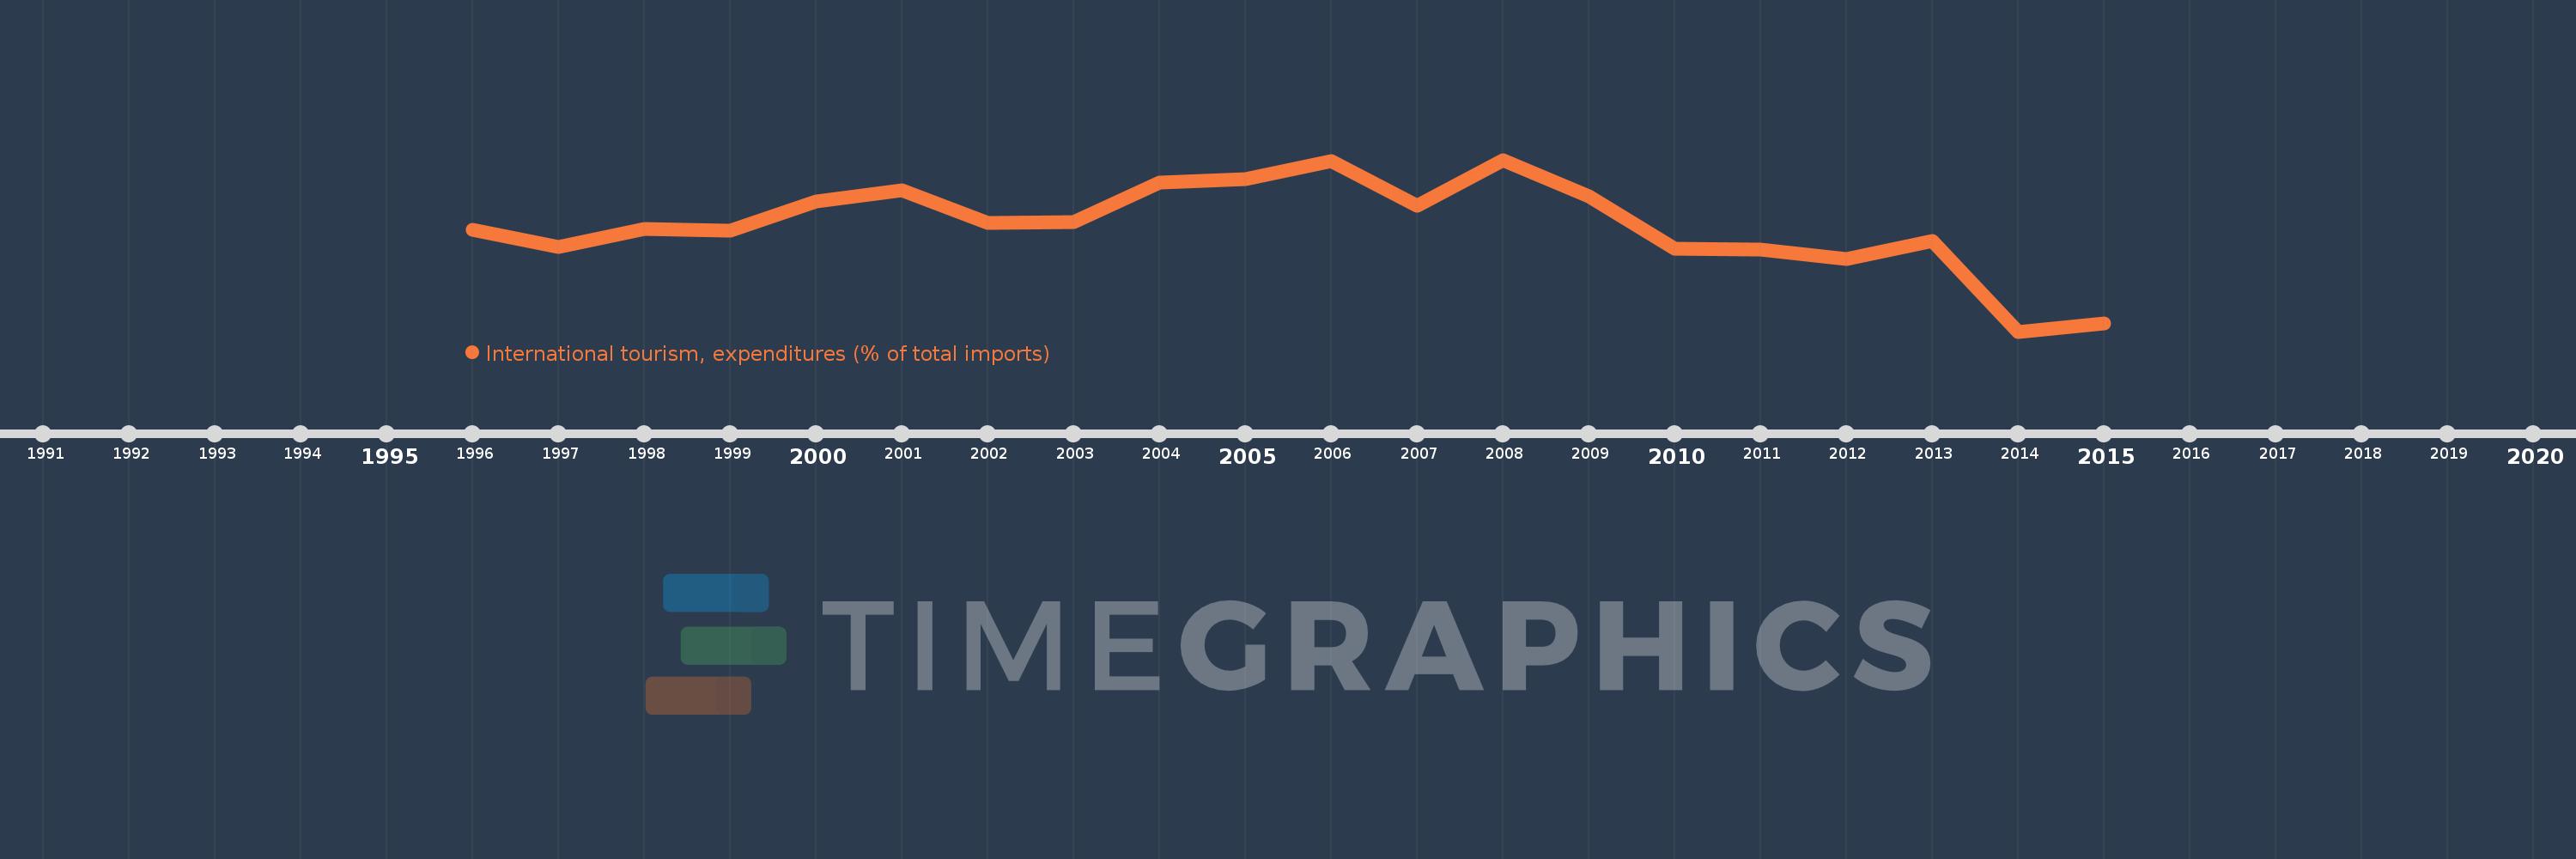
Questa scala temporale mostra un grafico dal 1996 anno al 2015 anno. Iceland. I dati fino ad 1995 anno non disponibili. Il numero di osservazioni attuali secondo i date: 20.
La fonte (nome):
Indicatori dello sviluppo mondiale
La fonte (organizzazione):
World Tourism Organization, Yearbook of Tourism Statistics, Compendium of Tourism Statistics and data files, and IMF and World Bank imports estimates.
Categorie:
Private Sector, Trade
sono stati aggiornati
23 apr 2017 anni
Indicatori delle variazioni dei valori per anni
In media:
17.527
Minima:
11.554
1 gen 2014 anni
Massimo:
21.222
1 gen 2008 anni
Alla data di osservazione
Valore
Variazione assoluta
La variazione rispetto al valore precedente
1 gen 1996 anni
17.303
+17.303
0.0%
1 gen 1997 anni
16.327
-0.976
-5.64%
1 gen 1998 anni
17.35
+1.023
6.26%
1 gen 1999 anni
17.255
-0.095
-0.55%
1 gen 2000 anni
18.879
+1.624
9.41%
1 gen 2001 anni
19.484
+0.605
3.2%
1 gen 2002 anni
17.688
-1.796
-9.22%
1 gen 2003 anni
17.712
+0.024
0.13%
1 gen 2004 anni
19.947
+2.236
12.62%
1 gen 2005 anni
20.113
+0.166
0.83%
1 gen 2006 anni
21.156
+1.043
5.18%
1 gen 2007 anni
18.619
-2.536
-11.99%
1 gen 2008 anni
21.222
+2.603
13.98%
1 gen 2009 anni
19.191
-2.031
-9.57%
1 gen 2010 anni
16.217
-2.974
-15.5%
1 gen 2011 anni
16.168
-0.049
-0.3%
1 gen 2012 anni
15.649
-0.52
-3.21%
1 gen 2013 anni
16.671
+1.023
6.53%
1 gen 2014 anni
11.554
-5.117
-30.69%
1 gen 2015 anni
12.033
+0.479
4.15%
Classificazione dei paesi secondo i statistiche attuali per anni