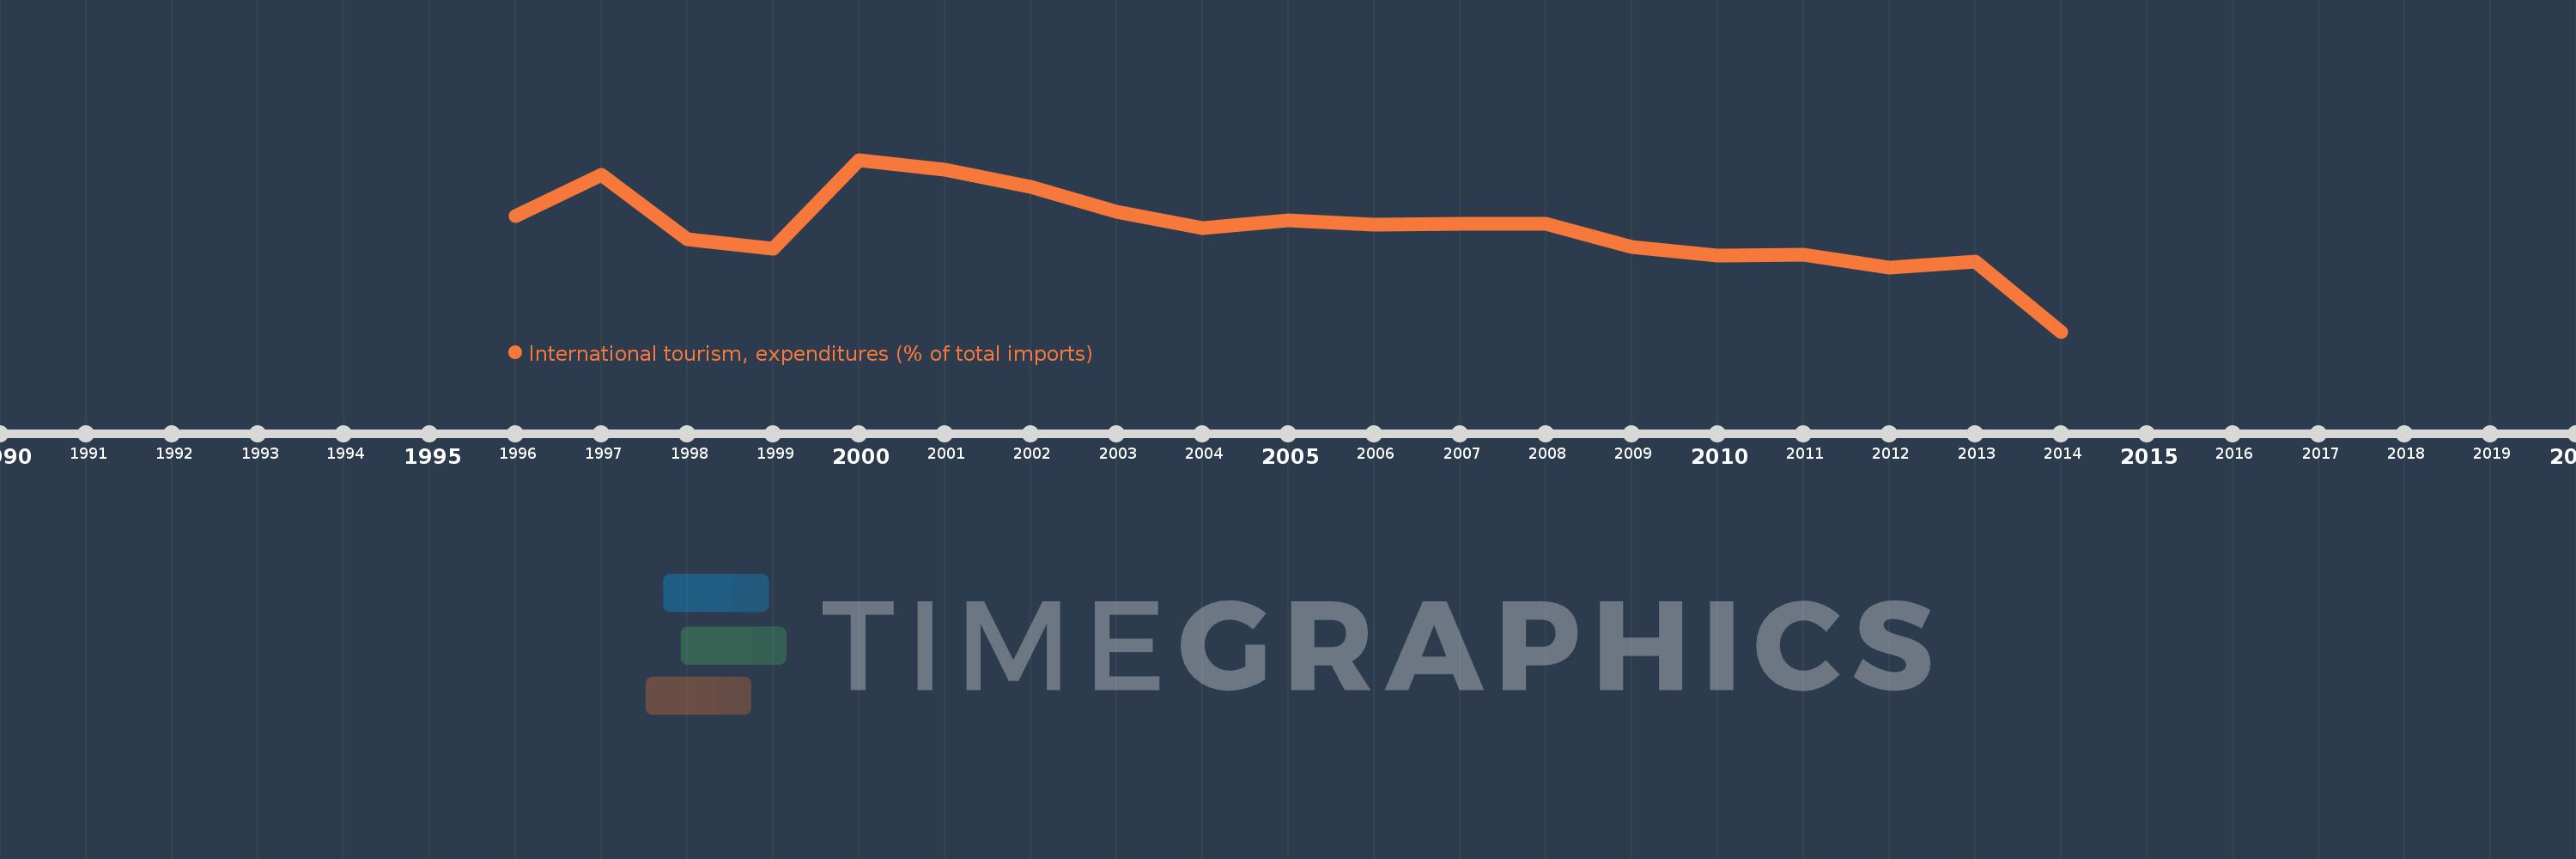
Questa scala temporale mostra un grafico dal 1996 anno al 2014 anno. Benin. I dati fino ad 1995 anno non disponibili. Il numero di osservazioni attuali secondo i date: 19.
La fonte (nome):
Indicatori dello sviluppo mondiale
La fonte (organizzazione):
World Tourism Organization, Yearbook of Tourism Statistics, Compendium of Tourism Statistics and data files, and IMF and World Bank imports estimates.
Categorie:
Private Sector, Trade
sono stati aggiornati
23 apr 2017 anni
Indicatori delle variazioni dei valori per anni
In media:
4.914
Minima:
1.192
1 gen 2014 anni
Massimo:
7.408
1 gen 2000 anni
Alla data di osservazione
Valore
Variazione assoluta
La variazione rispetto al valore precedente
1 gen 1996 anni
5.365
+5.365
0.0%
1 gen 1997 anni
6.858
+1.493
27.83%
1 gen 1998 anni
4.538
-2.32
-33.83%
1 gen 1999 anni
4.188
-0.35
-7.7%
1 gen 2000 anni
7.408
+3.219
76.86%
1 gen 2001 anni
7.065
-0.343
-4.63%
1 gen 2002 anni
6.444
-0.621
-8.79%
1 gen 2003 anni
5.52
-0.924
-14.34%
1 gen 2004 anni
4.941
-0.579
-10.49%
1 gen 2005 anni
5.225
+0.284
5.75%
1 gen 2006 anni
5.067
-0.158
-3.02%
1 gen 2007 anni
5.079
+0.012
0.23%
1 gen 2008 anni
5.09
+0.011
0.21%
1 gen 2009 anni
4.25
-0.839
-16.49%
1 gen 2010 anni
3.94
-0.311
-7.31%
1 gen 2011 anni
3.974
+0.034
0.87%
1 gen 2012 anni
3.515
-0.459
-11.54%
1 gen 2013 anni
3.711
+0.195
5.55%
1 gen 2014 anni
1.192
-2.518
-67.87%
Classificazione dei paesi secondo i statistiche attuali per anni