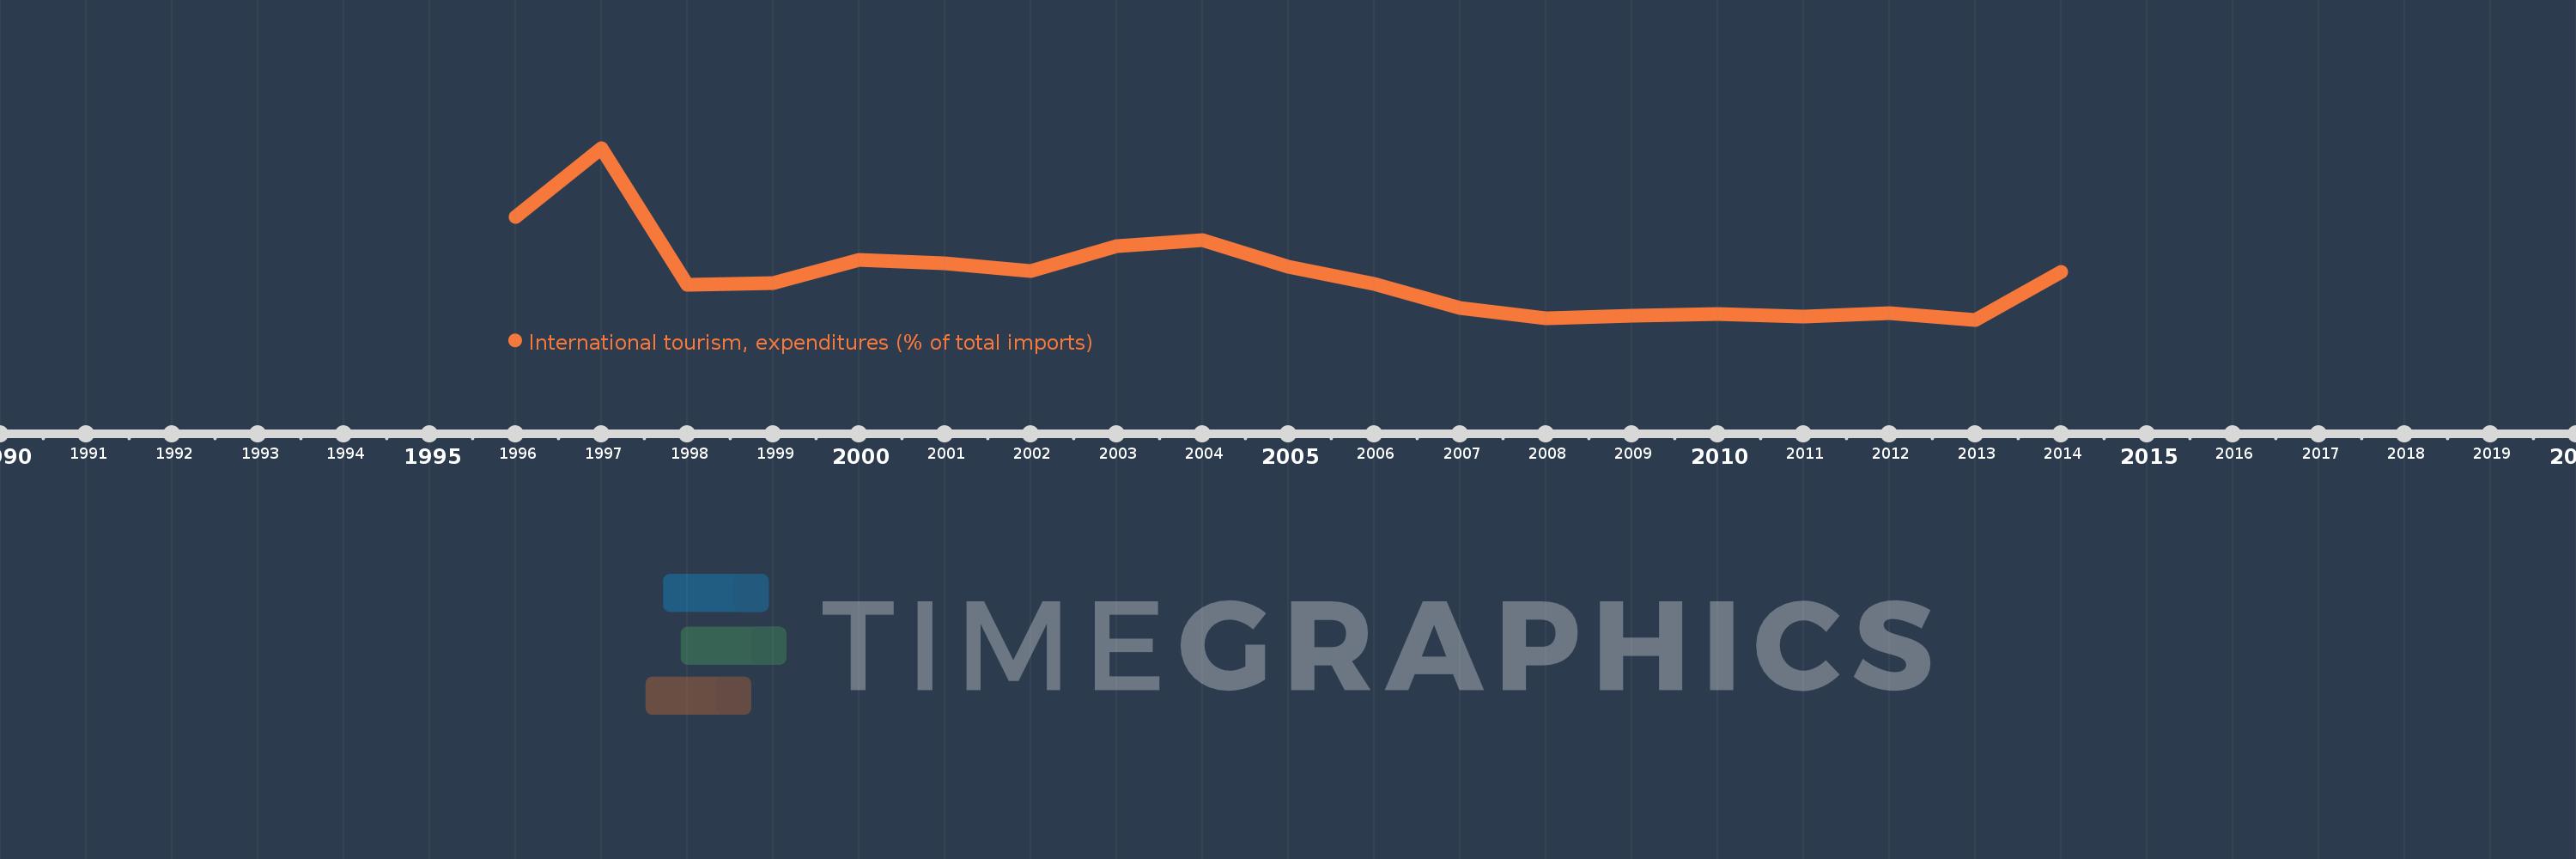
Questa scala temporale mostra un grafico dal 1996 anno al 2014 anno. Venezuela, RB. I dati fino ad 1995 anno non disponibili. Il numero di osservazioni attuali secondo i date: 19.
La fonte (nome):
Indicatori dello sviluppo mondiale
La fonte (organizzazione):
World Tourism Organization, Yearbook of Tourism Statistics, Compendium of Tourism Statistics and data files, and IMF and World Bank imports estimates.
Categorie:
Private Sector, Trade
sono stati aggiornati
23 apr 2017 anni
Indicatori delle variazioni dei valori per anni
In media:
6.833
Minima:
3.752
1 gen 2013 anni
Massimo:
15.806
1 gen 1997 anni
Alla data di osservazione
Valore
Variazione assoluta
La variazione rispetto al valore precedente
1 gen 1996 anni
10.955
+10.955
0.0%
1 gen 1997 anni
15.806
+4.851
44.28%
1 gen 1998 anni
6.2
-9.606
-60.78%
1 gen 1999 anni
6.333
+0.133
2.15%
1 gen 2000 anni
7.938
+1.605
25.34%
1 gen 2001 anni
7.732
-0.205
-2.59%
1 gen 2002 anni
7.191
-0.542
-7.01%
1 gen 2003 anni
8.946
+1.755
24.41%
1 gen 2004 anni
9.368
+0.422
4.72%
1 gen 2005 anni
7.454
-1.913
-20.43%
1 gen 2006 anni
6.28
-1.174
-15.75%
1 gen 2007 anni
4.57
-1.71
-27.22%
1 gen 2008 anni
3.853
-0.718
-15.7%
1 gen 2009 anni
4.025
+0.173
4.48%
1 gen 2010 anni
4.141
+0.116
2.89%
1 gen 2011 anni
3.994
-0.148
-3.57%
1 gen 2012 anni
4.208
+0.215
5.37%
1 gen 2013 anni
3.752
-0.457
-10.85%
1 gen 2014 anni
7.087
+3.335
88.89%
Classificazione dei paesi secondo i statistiche attuali per anni