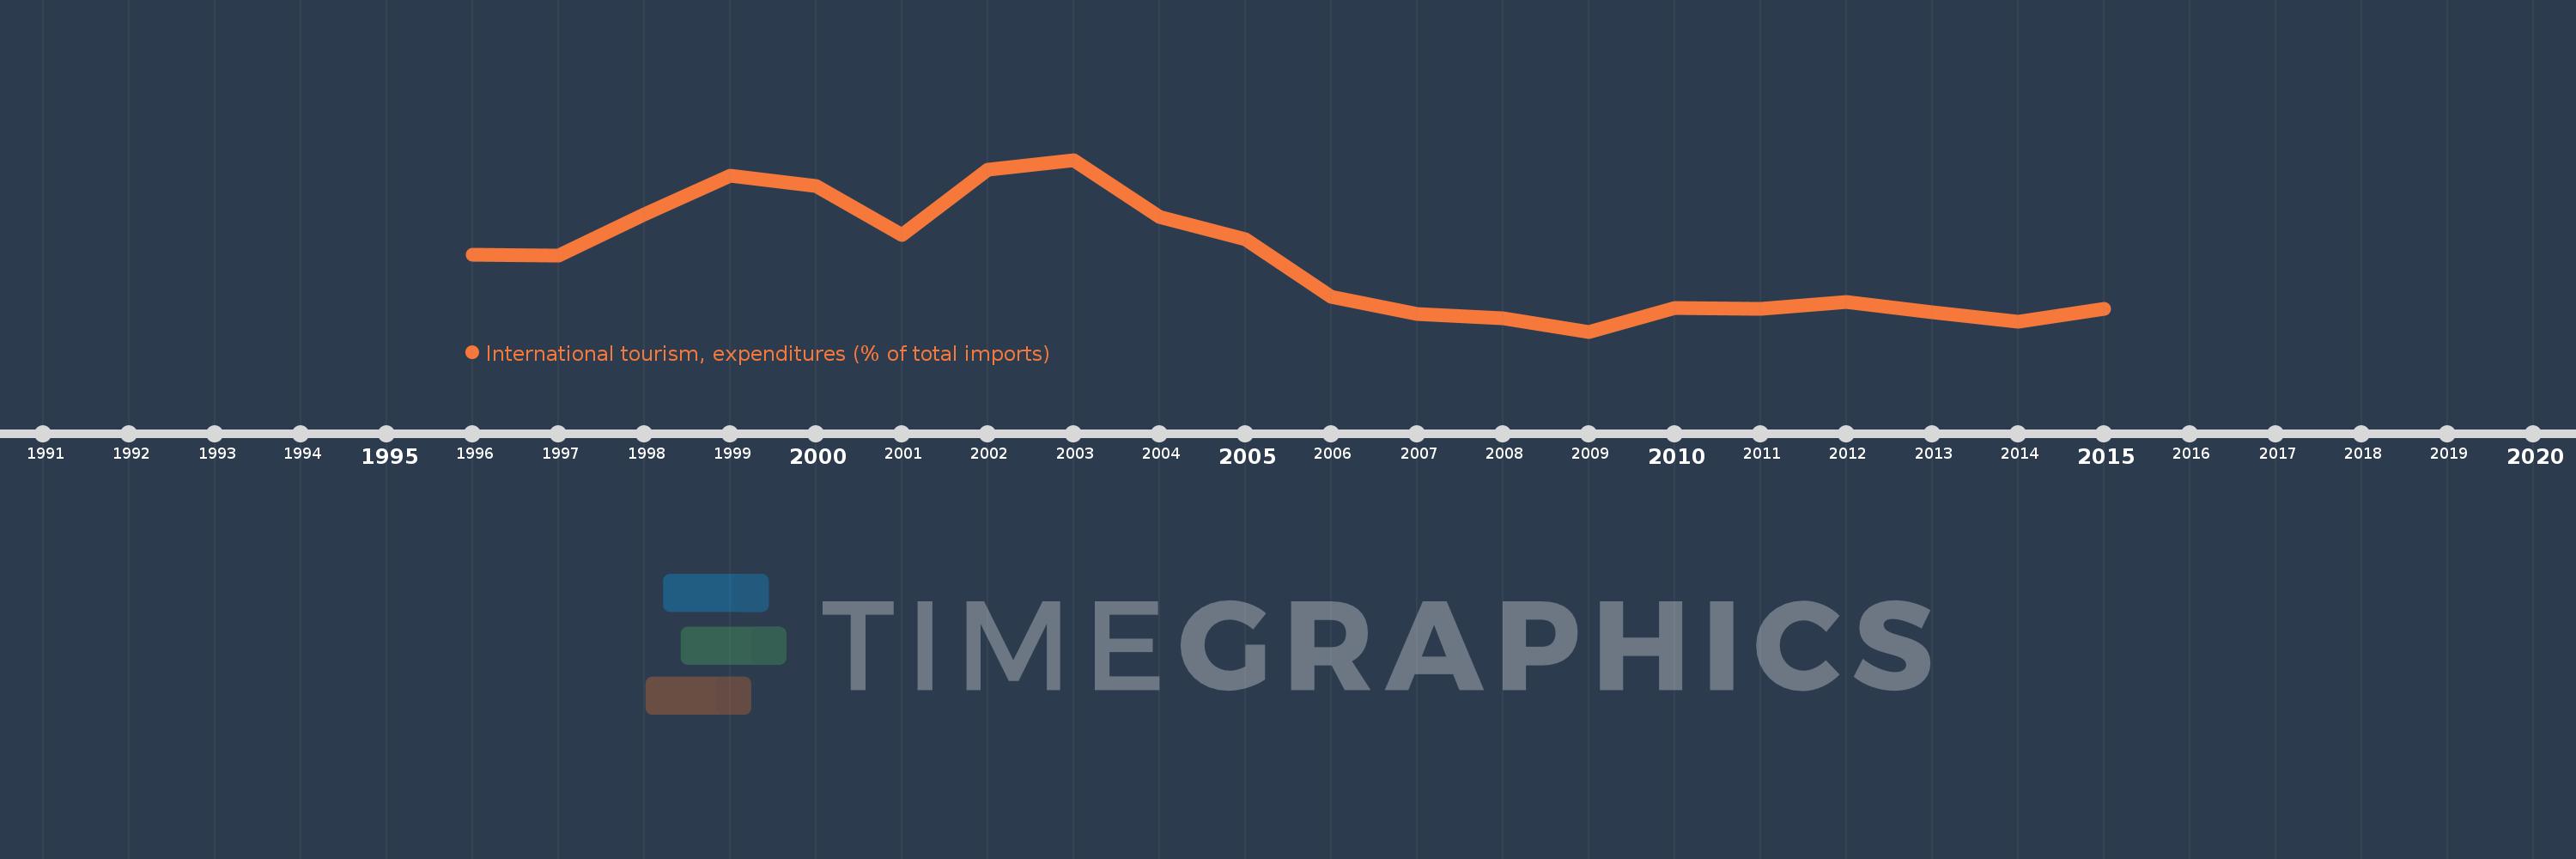
Questa scala temporale mostra un grafico dal 1996 anno al 2015 anno. Kazakhstan. I dati fino ad 1995 anno non disponibili. Il numero di osservazioni attuali secondo i date: 20.
La fonte (nome):
Indicatori dello sviluppo mondiale
La fonte (organizzazione):
World Tourism Organization, Yearbook of Tourism Statistics, Compendium of Tourism Statistics and data files, and IMF and World Bank imports estimates.
Categorie:
Private Sector, Trade
sono stati aggiornati
23 apr 2017 anni
Indicatori delle variazioni dei valori per anni
In media:
4.665
Minima:
2.746
1 gen 2009 anni
Massimo:
7.454
1 gen 2003 anni
Alla data di osservazione
Valore
Variazione assoluta
La variazione rispetto al valore precedente
1 gen 1996 anni
4.851
+4.851
0.0%
1 gen 1997 anni
4.818
-0.033
-0.68%
1 gen 1998 anni
5.952
+1.134
23.53%
1 gen 1999 anni
7.015
+1.064
17.87%
1 gen 2000 anni
6.742
-0.274
-3.9%
1 gen 2001 anni
5.385
-1.357
-20.13%
1 gen 2002 anni
7.193
+1.809
33.59%
1 gen 2003 anni
7.454
+0.26
3.62%
1 gen 2004 anni
5.884
-1.569
-21.05%
1 gen 2005 anni
5.268
-0.616
-10.48%
1 gen 2006 anni
3.692
-1.576
-29.91%
1 gen 2007 anni
3.224
-0.468
-12.69%
1 gen 2008 anni
3.103
-0.121
-3.75%
1 gen 2009 anni
2.746
-0.357
-11.52%
1 gen 2010 anni
3.382
+0.636
23.18%
1 gen 2011 anni
3.364
-0.018
-0.52%
1 gen 2012 anni
3.568
+0.203
6.05%
1 gen 2013 anni
3.285
-0.282
-7.91%
1 gen 2014 anni
3.01
-0.276
-8.39%
1 gen 2015 anni
3.368
+0.358
11.9%
Classificazione dei paesi secondo i statistiche attuali per anni