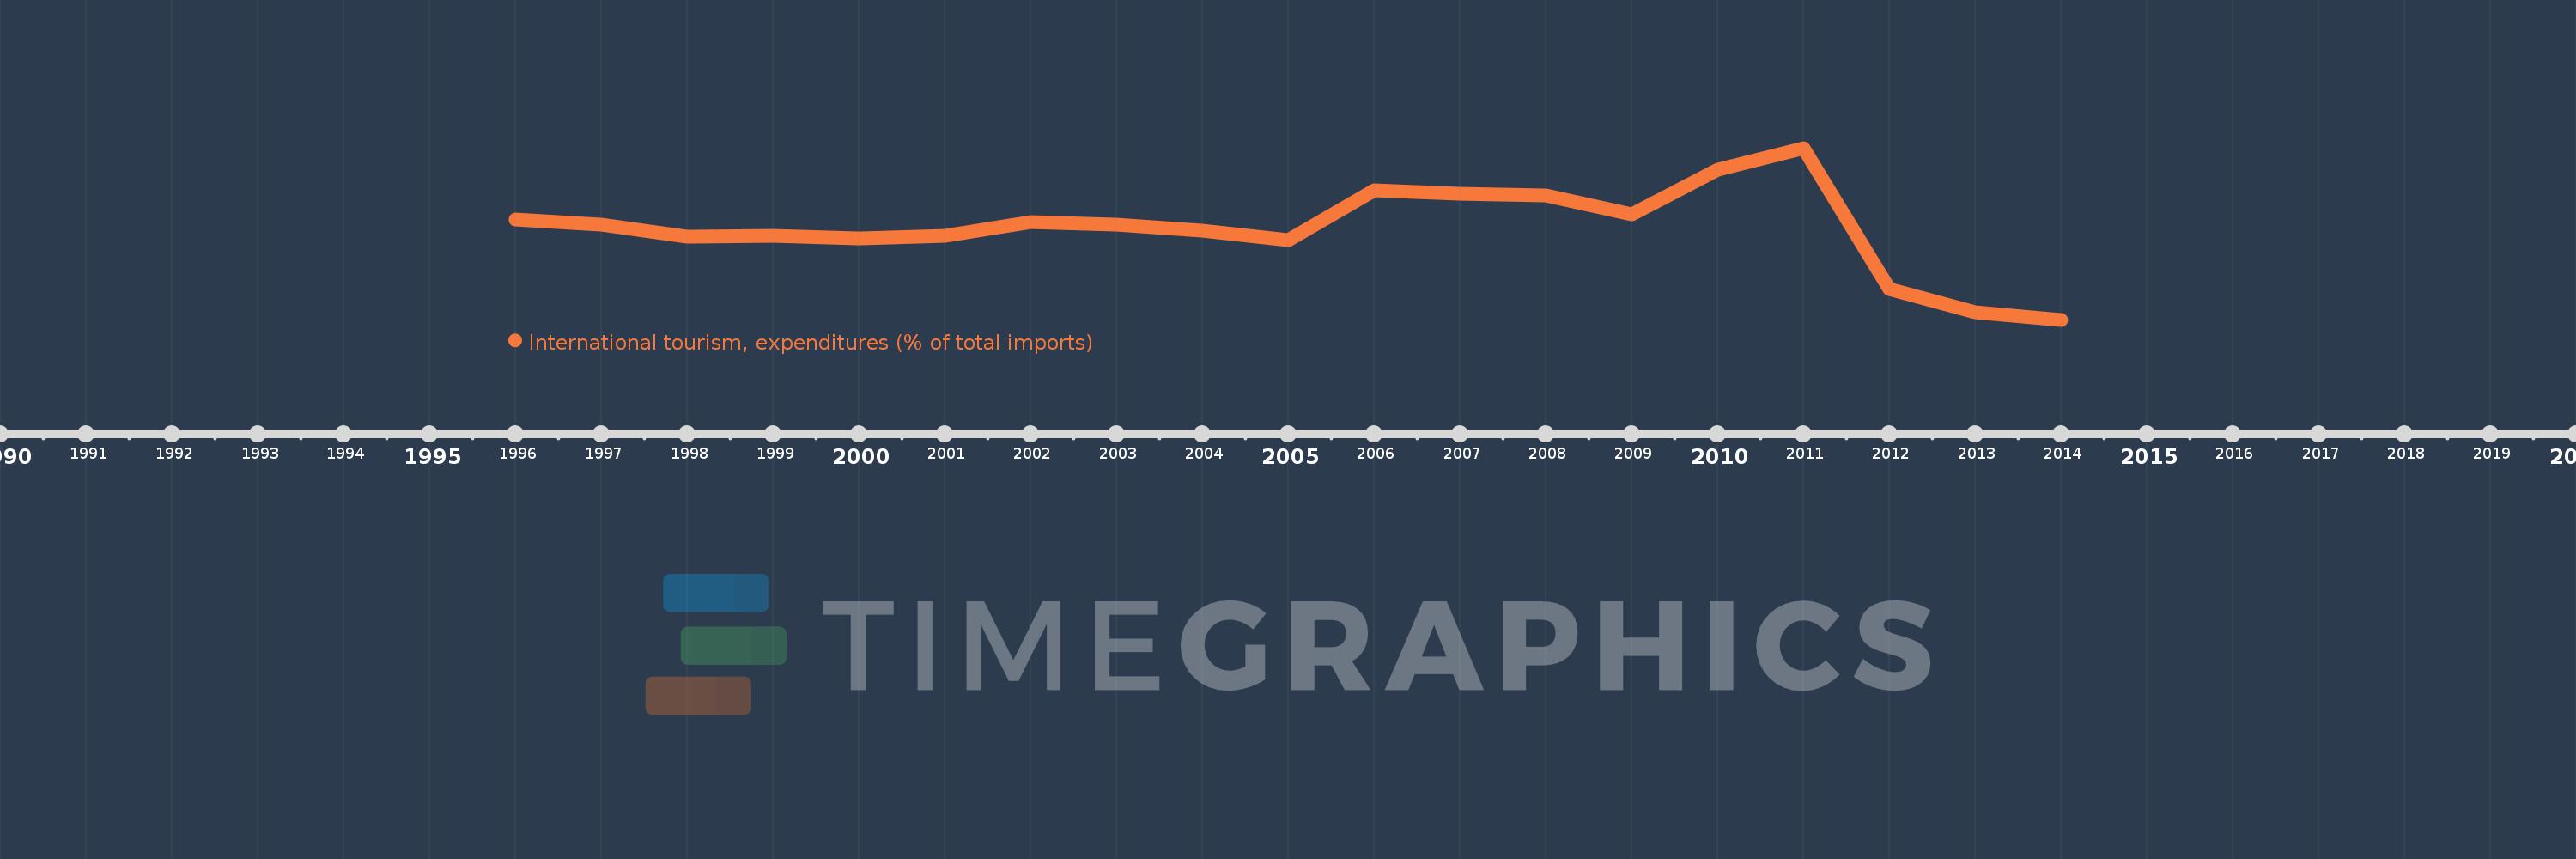
Questa scala temporale mostra un grafico dal 1996 anno al 2014 anno. Barbados. I dati fino ad 1995 anno non disponibili. Il numero di osservazioni attuali secondo i date: 19.
La fonte (nome):
Indicatori dello sviluppo mondiale
La fonte (organizzazione):
World Tourism Organization, Yearbook of Tourism Statistics, Compendium of Tourism Statistics and data files, and IMF and World Bank imports estimates.
Categorie:
Private Sector, Trade
sono stati aggiornati
23 apr 2017 anni
Indicatori delle variazioni dei valori per anni
In media:
9.851
Minima:
3.267
1 gen 2014 anni
Massimo:
15.667
1 gen 2011 anni
Alla data di osservazione
Valore
Variazione assoluta
La variazione rispetto al valore precedente
1 gen 1996 anni
10.492
+10.492
0.0%
1 gen 1997 anni
10.109
-0.383
-3.65%
1 gen 1998 anni
9.266
-0.843
-8.34%
1 gen 1999 anni
9.33
+0.064
0.69%
1 gen 2000 anni
9.14
-0.19
-2.04%
1 gen 2001 anni
9.307
+0.167
1.83%
1 gen 2002 anni
10.29
+0.983
10.57%
1 gen 2003 anni
10.114
-0.177
-1.72%
1 gen 2004 anni
9.674
-0.44
-4.35%
1 gen 2005 anni
9.001
-0.674
-6.96%
1 gen 2006 anni
12.619
+3.618
40.2%
1 gen 2007 anni
12.378
-0.241
-1.91%
1 gen 2008 anni
12.245
-0.133
-1.07%
1 gen 2009 anni
10.862
-1.383
-11.3%
1 gen 2010 anni
14.107
+3.245
29.87%
1 gen 2011 anni
15.667
+1.56
11.06%
1 gen 2012 anni
5.492
-10.174
-64.94%
1 gen 2013 anni
3.814
-1.678
-30.56%
1 gen 2014 anni
3.267
-0.547
-14.35%
Classificazione dei paesi secondo i statistiche attuali per anni