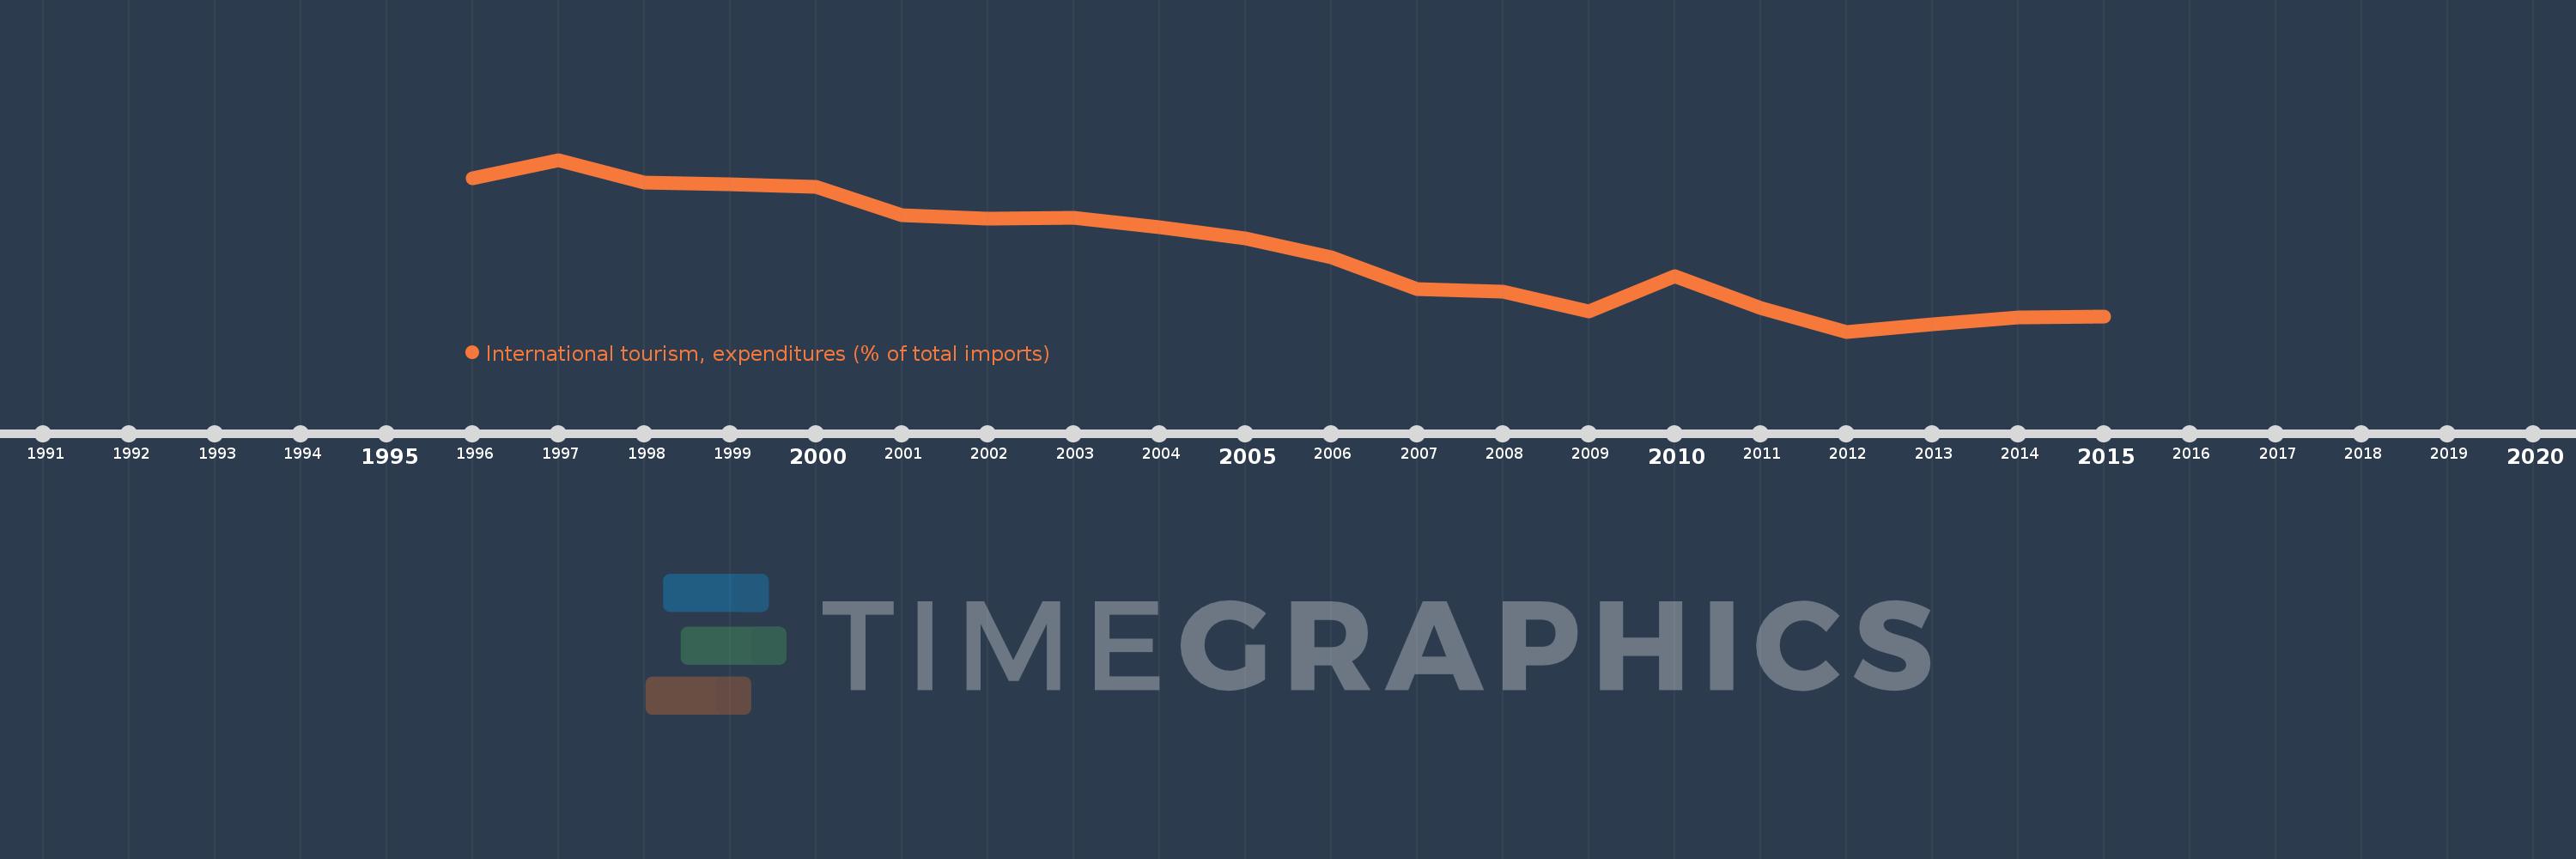
Questa scala temporale mostra un grafico dal 1996 anno al 2015 anno. OECD members. I dati fino ad 1995 anno non disponibili. Il numero di osservazioni attuali secondo i date: 20.
La fonte (nome):
Indicatori dello sviluppo mondiale
La fonte (organizzazione):
World Tourism Organization, Yearbook of Tourism Statistics, Compendium of Tourism Statistics and data files, and IMF and World Bank imports estimates.
Categorie:
Private Sector, Trade
sono stati aggiornati
23 apr 2017 anni
Indicatori delle variazioni dei valori per anni
In media:
6.504
Minima:
5.146
1 gen 2012 anni
Massimo:
8.061
1 gen 1997 anni
Alla data di osservazione
Valore
Variazione assoluta
La variazione rispetto al valore precedente
1 gen 1996 anni
7.745
+7.745
0.0%
1 gen 1997 anni
8.061
+0.316
4.07%
1 gen 1998 anni
7.676
-0.385
-4.78%
1 gen 1999 anni
7.651
-0.025
-0.32%
1 gen 2000 anni
7.6
-0.051
-0.67%
1 gen 2001 anni
7.114
-0.486
-6.4%
1 gen 2002 anni
7.065
-0.049
-0.69%
1 gen 2003 anni
7.077
+0.011
0.16%
1 gen 2004 anni
6.915
-0.162
-2.29%
1 gen 2005 anni
6.723
-0.192
-2.78%
1 gen 2006 anni
6.41
-0.312
-4.65%
1 gen 2007 anni
5.864
-0.546
-8.52%
1 gen 2008 anni
5.818
-0.047
-0.79%
1 gen 2009 anni
5.495
-0.323
-5.55%
1 gen 2010 anni
6.092
+0.598
10.88%
1 gen 2011 anni
5.55
-0.543
-8.91%
1 gen 2012 anni
5.146
-0.403
-7.27%
1 gen 2013 anni
5.274
+0.128
2.49%
1 gen 2014 anni
5.389
+0.115
2.17%
1 gen 2015 anni
5.408
+0.019
0.35%
Classificazione dei paesi secondo i statistiche attuali per anni