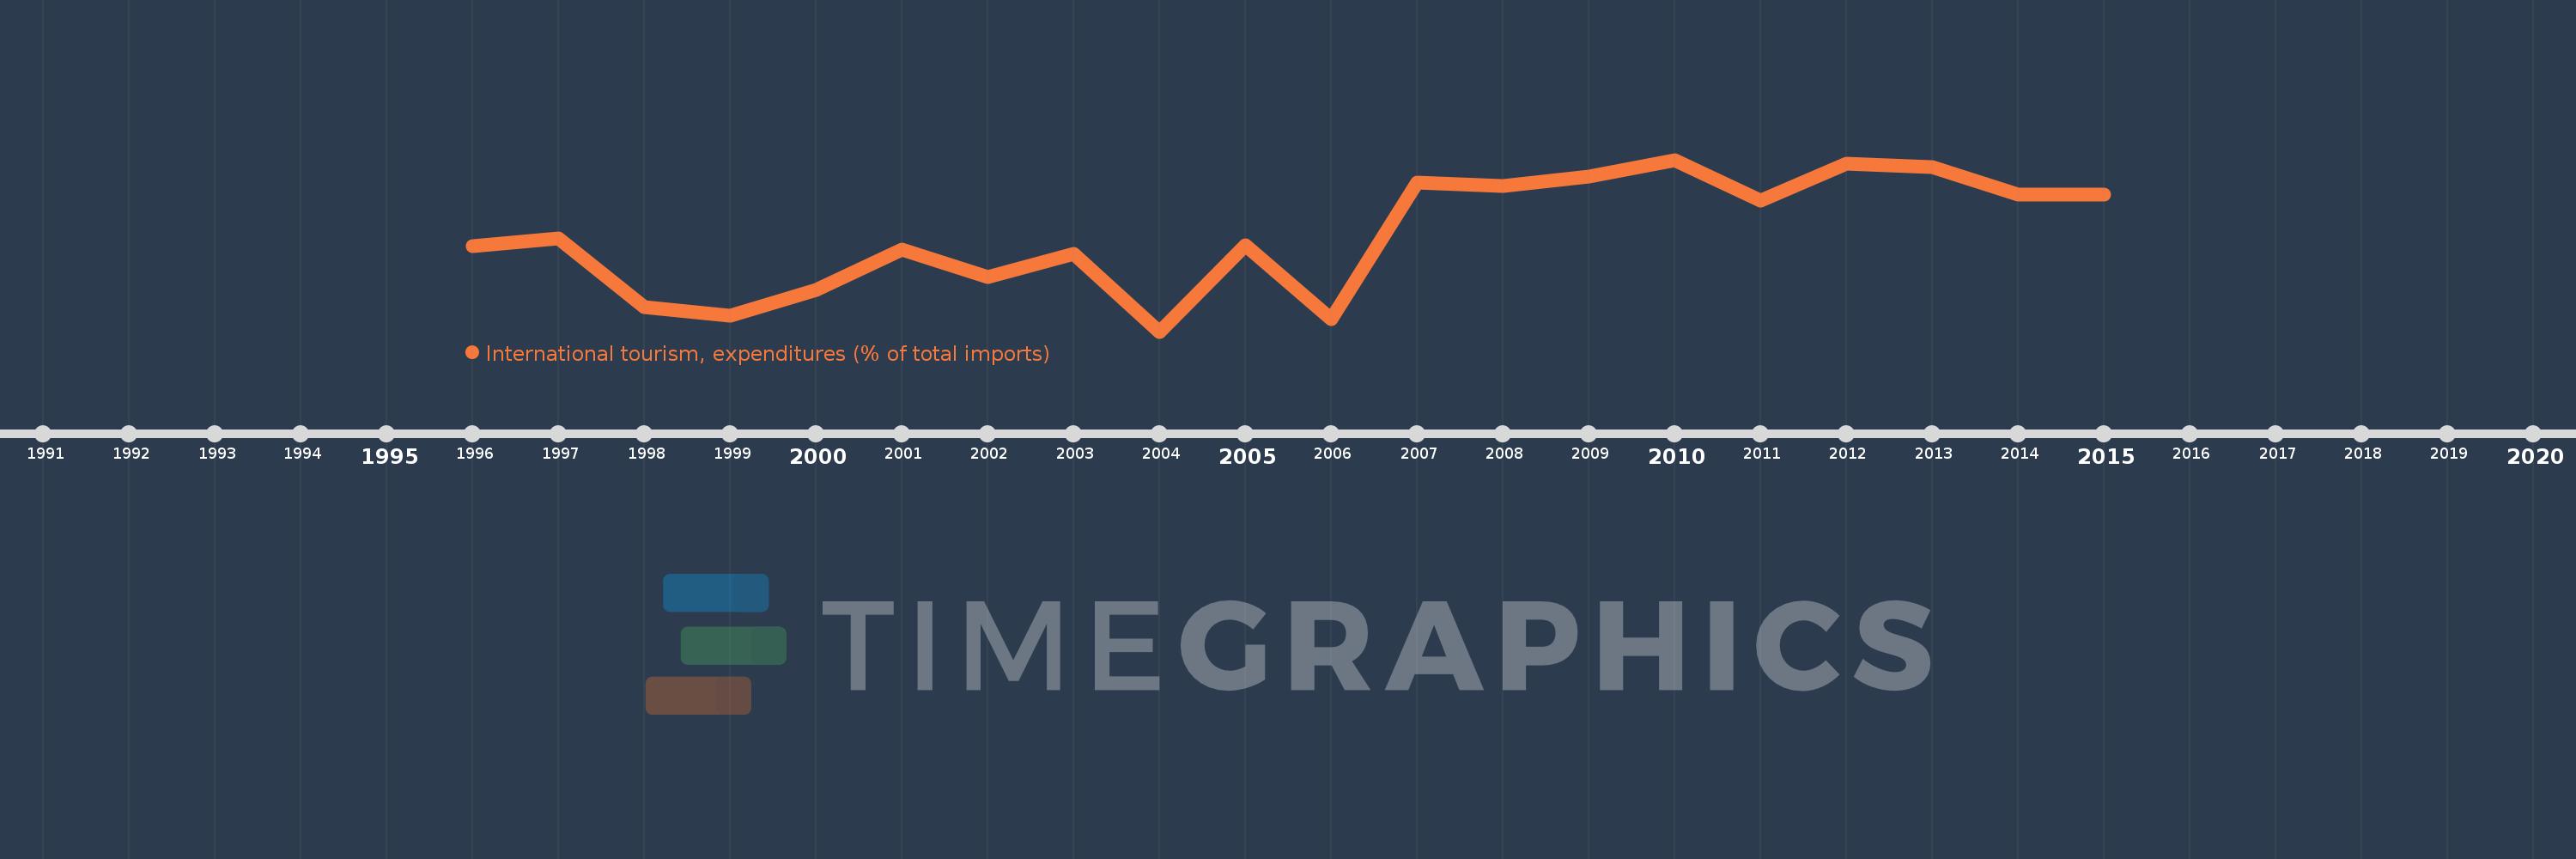
Questa scala temporale mostra un grafico dal 1996 anno al 2015 anno. Solomon Islands. I dati fino ad 1995 anno non disponibili. Il numero di osservazioni attuali secondo i date: 20.
La fonte (nome):
Indicatori dello sviluppo mondiale
La fonte (organizzazione):
World Tourism Organization, Yearbook of Tourism Statistics, Compendium of Tourism Statistics and data files, and IMF and World Bank imports estimates.
Categorie:
Private Sector, Trade
sono stati aggiornati
23 apr 2017 anni
Indicatori delle variazioni dei valori per anni
In media:
7.974
Minima:
4.106
1 gen 2004 anni
Massimo:
10.987
1 gen 2010 anni
Alla data di osservazione
Valore
Variazione assoluta
La variazione rispetto al valore precedente
1 gen 1996 anni
7.518
+7.518
0.0%
1 gen 1997 anni
7.839
+0.321
4.27%
1 gen 1998 anni
5.073
-2.765
-35.28%
1 gen 1999 anni
4.757
-0.316
-6.24%
1 gen 2000 anni
5.771
+1.014
21.32%
1 gen 2001 anni
7.397
+1.626
28.18%
1 gen 2002 anni
6.305
-1.092
-14.77%
1 gen 2003 anni
7.219
+0.915
14.51%
1 gen 2004 anni
4.106
-3.113
-43.12%
1 gen 2005 anni
7.559
+3.453
84.09%
1 gen 2006 anni
4.608
-2.952
-39.05%
1 gen 2007 anni
10.061
+5.453
118.35%
1 gen 2008 anni
9.95
-0.111
-1.1%
1 gen 2009 anni
10.311
+0.361
3.63%
1 gen 2010 anni
10.987
+0.676
6.56%
1 gen 2011 anni
9.345
-1.642
-14.95%
1 gen 2012 anni
10.818
+1.473
15.76%
1 gen 2013 anni
10.684
-0.134
-1.24%
1 gen 2014 anni
9.585
-1.098
-10.28%
1 gen 2015 anni
9.595
+0.009
0.1%
Classificazione dei paesi secondo i statistiche attuali per anni