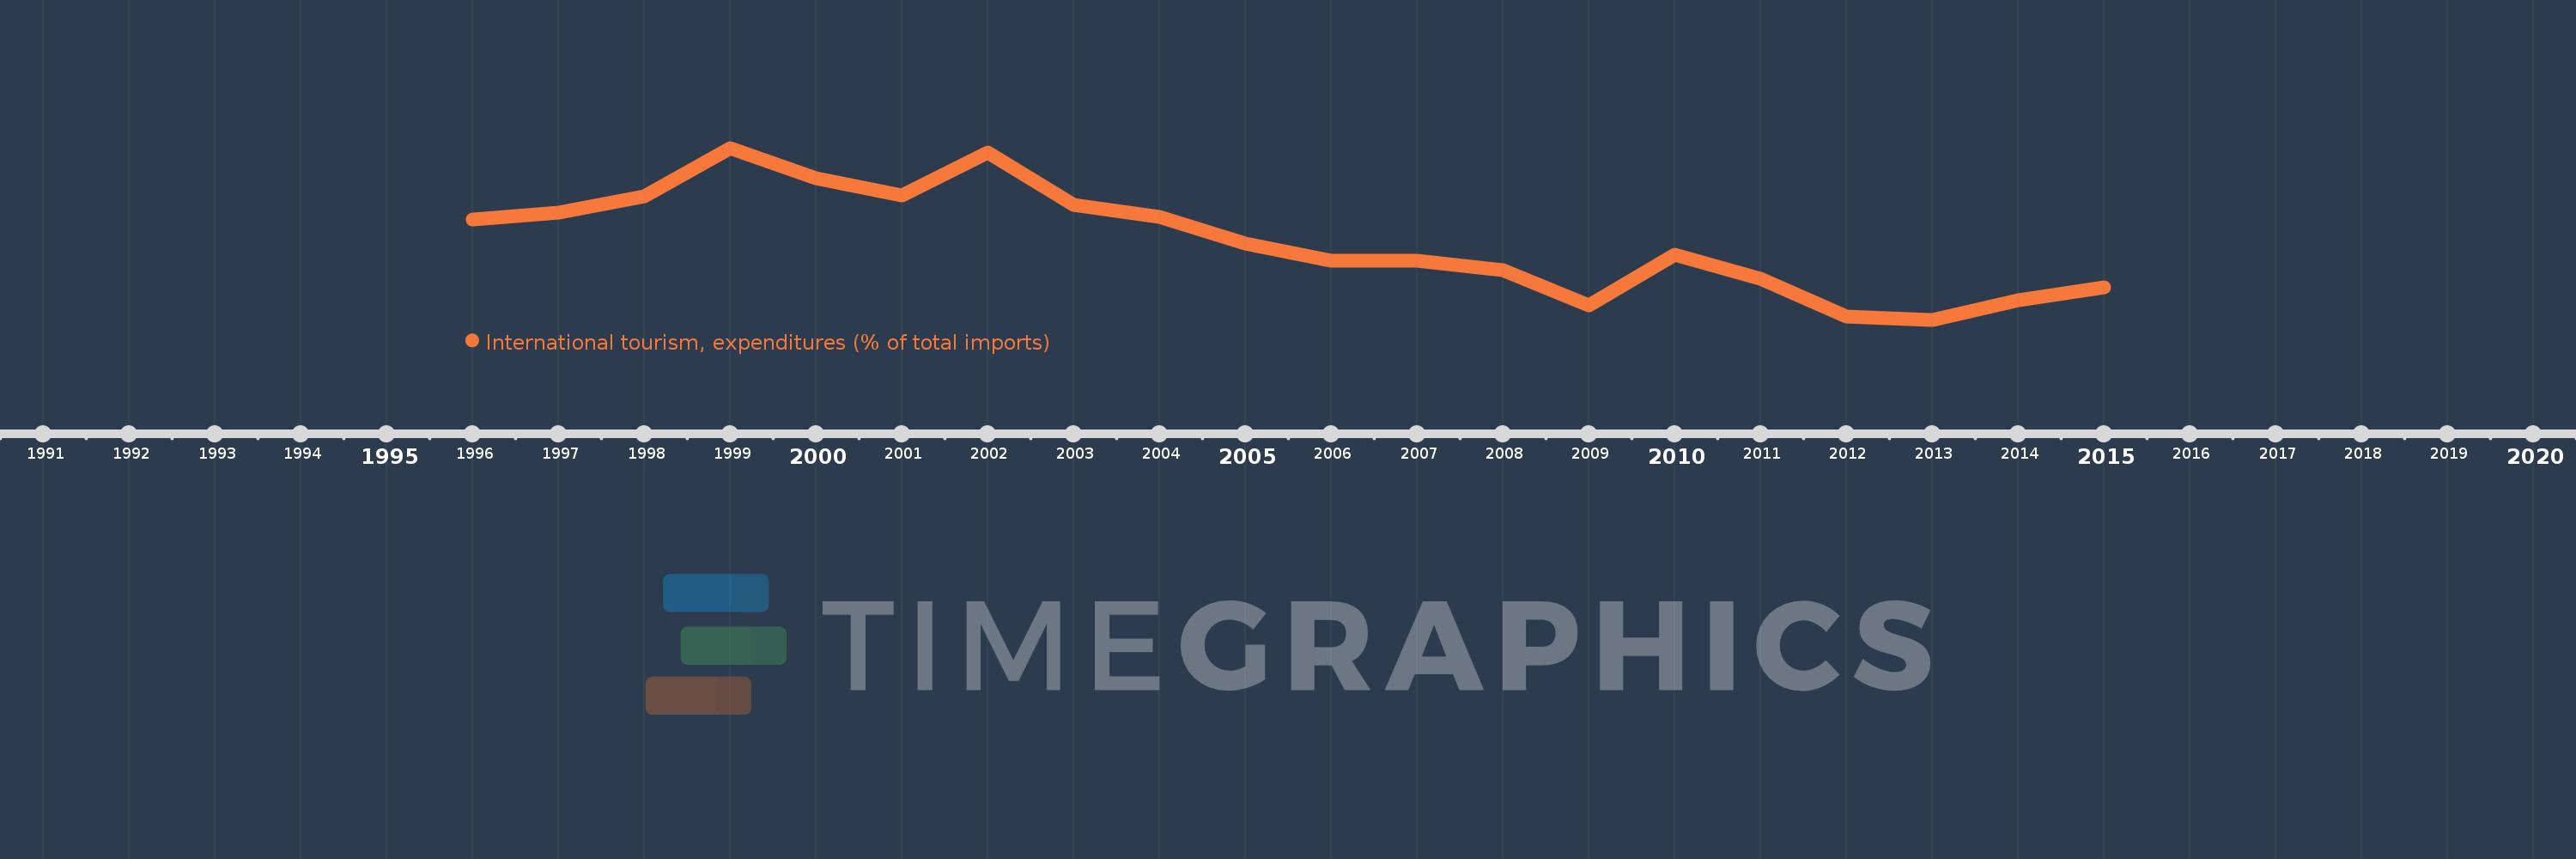
Questa scala temporale mostra un grafico dal 1996 anno al 2015 anno. Israel. I dati fino ad 1995 anno non disponibili. Il numero di osservazioni attuali secondo i date: 20.
La fonte (nome):
Indicatori dello sviluppo mondiale
La fonte (organizzazione):
World Tourism Organization, Yearbook of Tourism Statistics, Compendium of Tourism Statistics and data files, and IMF and World Bank imports estimates.
Categorie:
Private Sector, Trade
sono stati aggiornati
23 apr 2017 anni
Indicatori delle variazioni dei valori per anni
In media:
6.971
Minima:
5.248
1 gen 2013 anni
Massimo:
9.012
1 gen 1999 anni
Alla data di osservazione
Valore
Variazione assoluta
La variazione rispetto al valore precedente
1 gen 1996 anni
7.442
+7.442
0.0%
1 gen 1997 anni
7.587
+0.145
1.95%
1 gen 1998 anni
7.945
+0.358
4.72%
1 gen 1999 anni
9.012
+1.068
13.44%
1 gen 2000 anni
8.355
-0.657
-7.29%
1 gen 2001 anni
7.977
-0.378
-4.52%
1 gen 2002 anni
8.906
+0.928
11.64%
1 gen 2003 anni
7.757
-1.149
-12.9%
1 gen 2004 anni
7.505
-0.252
-3.25%
1 gen 2005 anni
6.924
-0.581
-7.74%
1 gen 2006 anni
6.55
-0.374
-5.4%
1 gen 2007 anni
6.542
-0.007
-0.11%
1 gen 2008 anni
6.334
-0.208
-3.19%
1 gen 2009 anni
5.568
-0.766
-12.09%
1 gen 2010 anni
6.677
+1.109
19.93%
1 gen 2011 anni
6.137
-0.54
-8.09%
1 gen 2012 anni
5.322
-0.815
-13.29%
1 gen 2013 anni
5.248
-0.074
-1.4%
1 gen 2014 anni
5.673
+0.425
8.1%
1 gen 2015 anni
5.951
+0.278
4.91%
Classificazione dei paesi secondo i statistiche attuali per anni