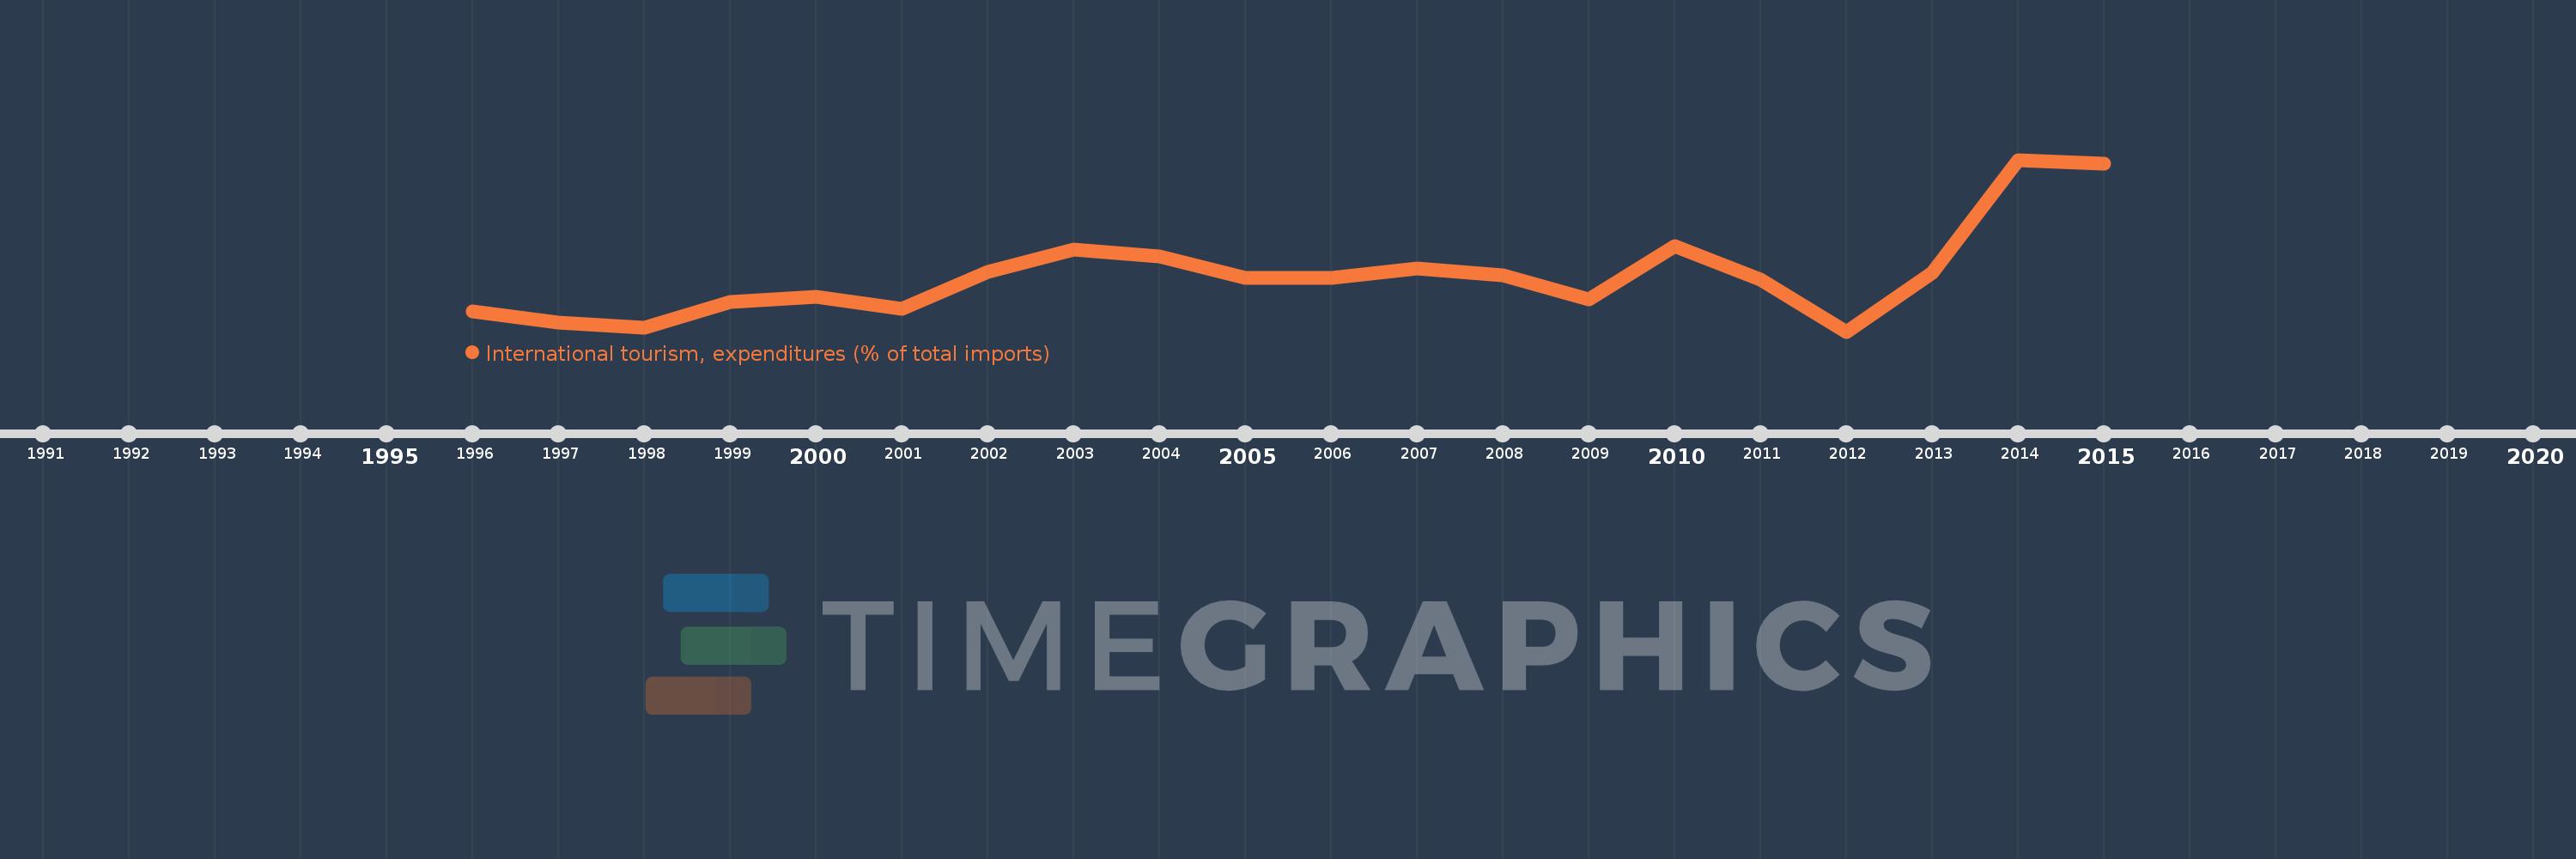
Questa scala temporale mostra un grafico dal 1996 anno al 2015 anno. Sri Lanka. I dati fino ad 1995 anno non disponibili. Il numero di osservazioni attuali secondo i date: 20.
La fonte (nome):
Indicatori dello sviluppo mondiale
La fonte (organizzazione):
World Tourism Organization, Yearbook of Tourism Statistics, Compendium of Tourism Statistics and data files, and IMF and World Bank imports estimates.
Categorie:
Private Sector, Trade
sono stati aggiornati
23 apr 2017 anni
Indicatori delle variazioni dei valori per anni
In media:
5.559
Minima:
4.161
1 gen 2012 anni
Massimo:
8.406
1 gen 2014 anni
Alla data di osservazione
Valore
Variazione assoluta
La variazione rispetto al valore precedente
1 gen 1996 anni
4.664
+4.664
0.0%
1 gen 1997 anni
4.378
-0.287
-6.15%
1 gen 1998 anni
4.255
-0.123
-2.81%
1 gen 1999 anni
4.884
+0.629
14.79%
1 gen 2000 anni
5.03
+0.146
2.99%
1 gen 2001 anni
4.725
-0.305
-6.06%
1 gen 2002 anni
5.641
+0.916
19.37%
1 gen 2003 anni
6.187
+0.546
9.68%
1 gen 2004 anni
6.013
-0.174
-2.82%
1 gen 2005 anni
5.479
-0.534
-8.88%
1 gen 2006 anni
5.484
+0.005
0.09%
1 gen 2007 anni
5.731
+0.247
4.5%
1 gen 2008 anni
5.553
-0.178
-3.11%
1 gen 2009 anni
4.952
-0.601
-10.83%
1 gen 2010 anni
6.278
+1.326
26.78%
1 gen 2011 anni
5.441
-0.837
-13.33%
1 gen 2012 anni
4.161
-1.28
-23.52%
1 gen 2013 anni
5.61
+1.449
34.82%
1 gen 2014 anni
8.406
+2.796
49.84%
1 gen 2015 anni
8.305
-0.101
-1.2%
Classificazione dei paesi secondo i statistiche attuali per anni