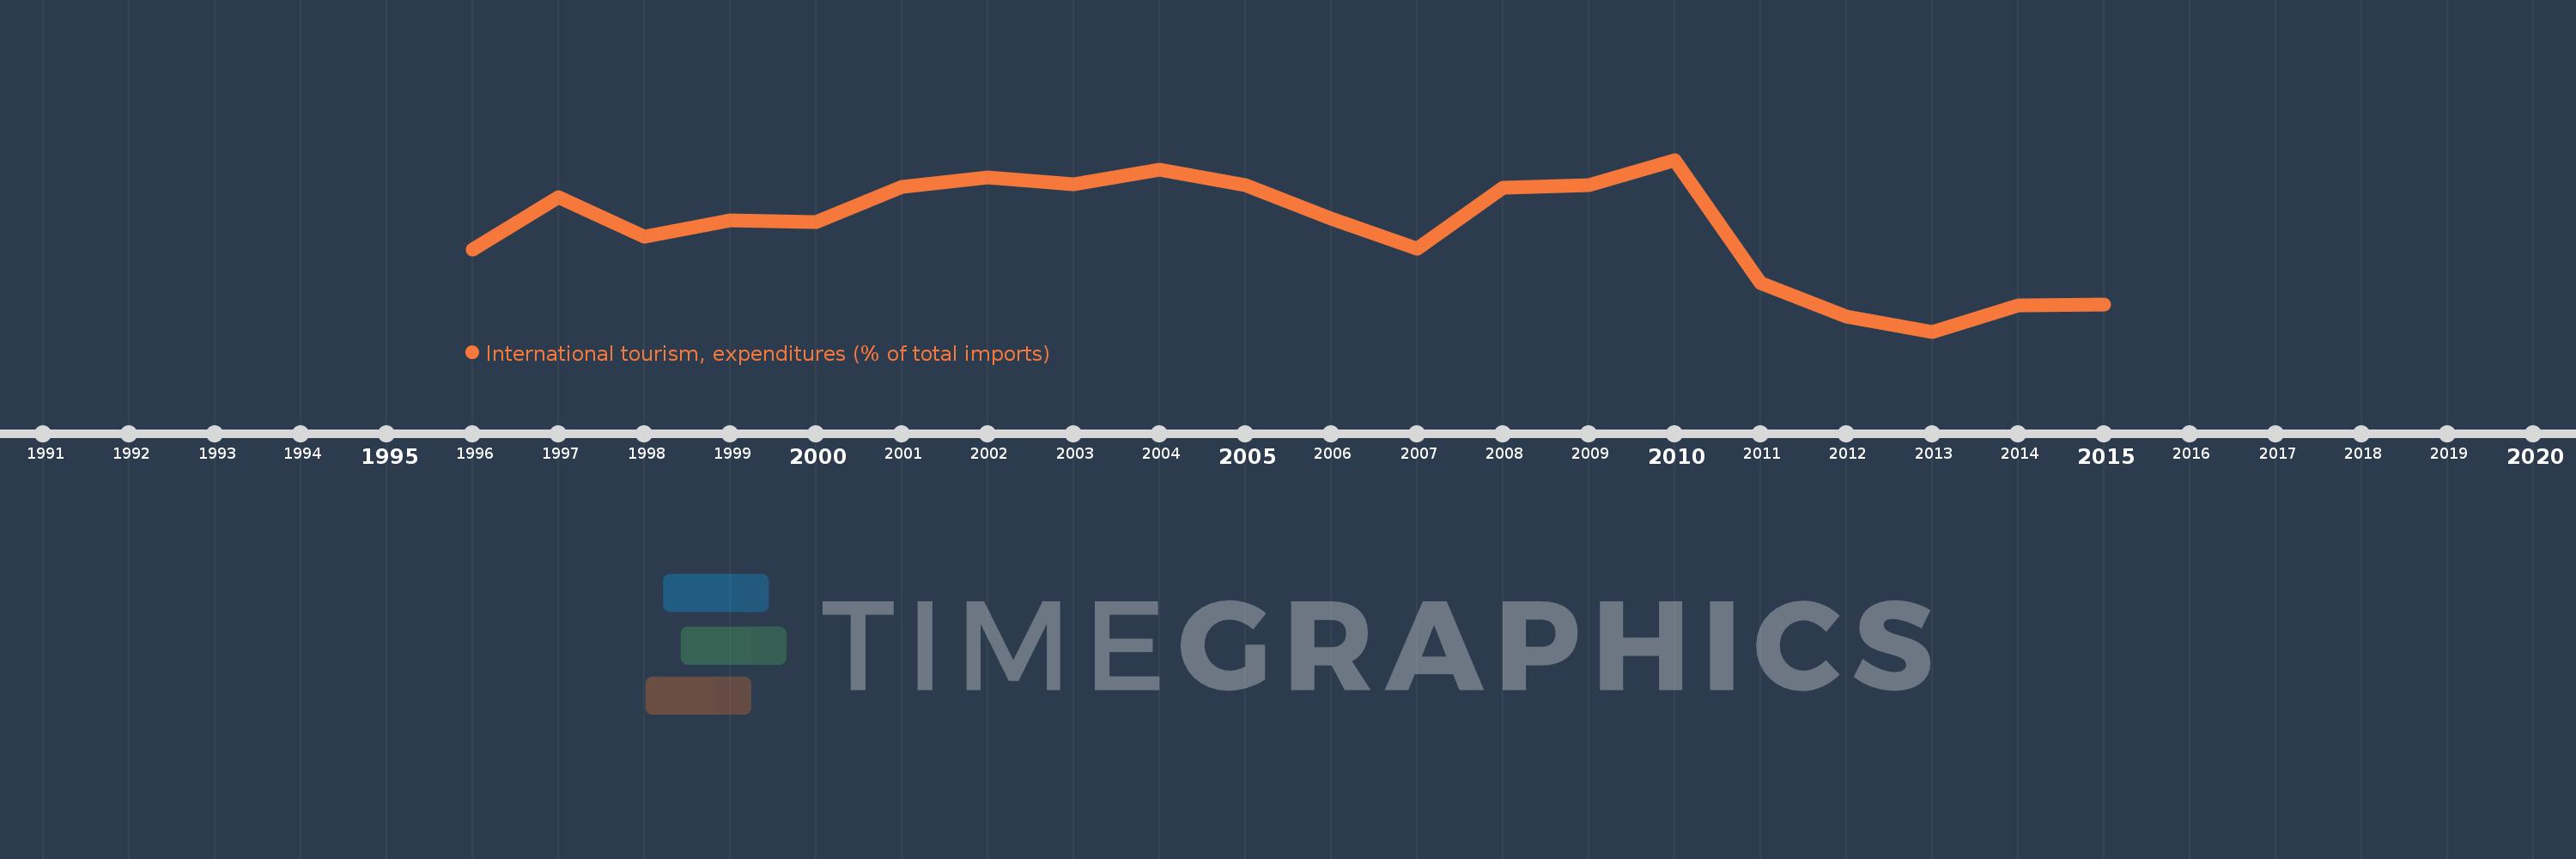
Questa scala temporale mostra un grafico dal 1996 anno al 2015 anno. Nicaragua. I dati fino ad 1995 anno non disponibili. Il numero di osservazioni attuali secondo i date: 20.
La fonte (nome):
Indicatori dello sviluppo mondiale
La fonte (organizzazione):
World Tourism Organization, Yearbook of Tourism Statistics, Compendium of Tourism Statistics and data files, and IMF and World Bank imports estimates.
Categorie:
Private Sector, Trade
sono stati aggiornati
23 apr 2017 anni
Indicatori delle variazioni dei valori per anni
In media:
5.49
Minima:
3.525
1 gen 2013 anni
Massimo:
6.801
1 gen 2010 anni
Alla data di osservazione
Valore
Variazione assoluta
La variazione rispetto al valore precedente
1 gen 1996 anni
5.082
+5.082
0.0%
1 gen 1997 anni
6.095
+1.013
19.92%
1 gen 1998 anni
5.342
-0.753
-12.36%
1 gen 1999 anni
5.646
+0.305
5.7%
1 gen 2000 anni
5.608
-0.038
-0.68%
1 gen 2001 anni
6.288
+0.68
12.12%
1 gen 2002 anni
6.461
+0.174
2.76%
1 gen 2003 anni
6.336
-0.126
-1.94%
1 gen 2004 anni
6.61
+0.274
4.33%
1 gen 2005 anni
6.32
-0.29
-4.39%
1 gen 2006 anni
5.679
-0.641
-10.15%
1 gen 2007 anni
5.108
-0.571
-10.05%
1 gen 2008 anni
6.269
+1.161
22.73%
1 gen 2009 anni
6.317
+0.049
0.78%
1 gen 2010 anni
6.801
+0.484
7.66%
1 gen 2011 anni
4.444
-2.357
-34.66%
1 gen 2012 anni
3.807
-0.638
-14.35%
1 gen 2013 anni
3.525
-0.281
-7.39%
1 gen 2014 anni
4.031
+0.505
14.34%
1 gen 2015 anni
4.037
+0.007
0.16%
Classificazione dei paesi secondo i statistiche attuali per anni