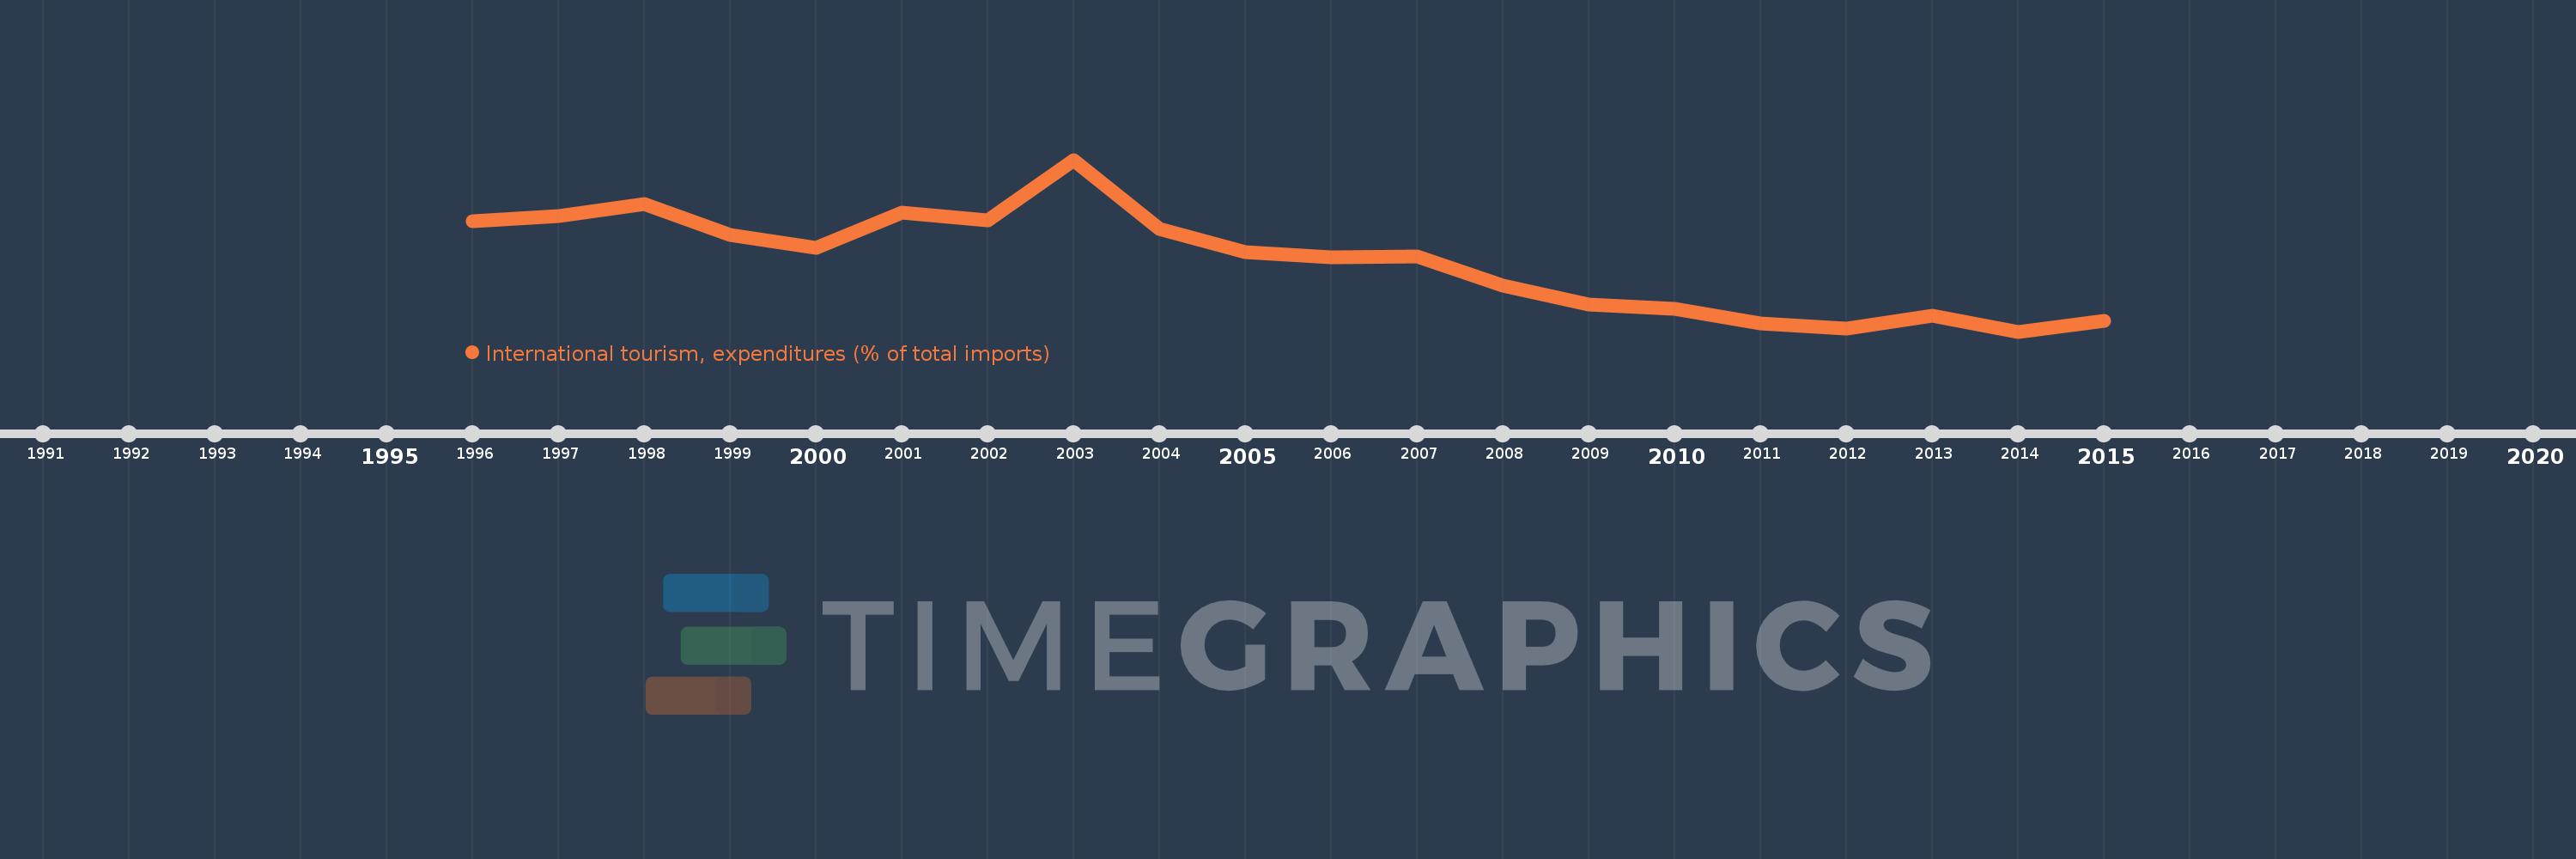
Questa scala temporale mostra un grafico dal 1996 anno al 2015 anno. Malawi. I dati fino ad 1995 anno non disponibili. Il numero di osservazioni attuali secondo i date: 20.
La fonte (nome):
Indicatori dello sviluppo mondiale
La fonte (organizzazione):
World Tourism Organization, Yearbook of Tourism Statistics, Compendium of Tourism Statistics and data files, and IMF and World Bank imports estimates.
Categorie:
Private Sector, Trade
sono stati aggiornati
23 apr 2017 anni
Indicatori delle variazioni dei valori per anni
In media:
6.213
Minima:
3.043
1 gen 2014 anni
Massimo:
10.816
1 gen 2003 anni
Alla data di osservazione
Valore
Variazione assoluta
La variazione rispetto al valore precedente
1 gen 1996 anni
8.028
+8.028
0.0%
1 gen 1997 anni
8.276
+0.248
3.09%
1 gen 1998 anni
8.825
+0.549
6.63%
1 gen 1999 anni
7.4
-1.425
-16.14%
1 gen 2000 anni
6.845
-0.556
-7.51%
1 gen 2001 anni
8.425
+1.58
23.09%
1 gen 2002 anni
8.079
-0.346
-4.1%
1 gen 2003 anni
10.816
+2.737
33.87%
1 gen 2004 anni
7.674
-3.142
-29.05%
1 gen 2005 anni
6.629
-1.045
-13.62%
1 gen 2006 anni
6.415
-0.214
-3.22%
1 gen 2007 anni
6.44
+0.024
0.38%
1 gen 2008 anni
5.137
-1.303
-20.23%
1 gen 2009 anni
4.285
-0.852
-16.58%
1 gen 2010 anni
4.067
-0.218
-5.09%
1 gen 2011 anni
3.406
-0.661
-16.26%
1 gen 2012 anni
3.192
-0.214
-6.28%
1 gen 2013 anni
3.758
+0.566
17.73%
1 gen 2014 anni
3.043
-0.715
-19.03%
1 gen 2015 anni
3.517
+0.474
15.57%
Classificazione dei paesi secondo i statistiche attuali per anni