29
/
en
AIzaSyAYiBZKx7MnpbEhh9jyipgxe19OcubqV5w
April 1, 2024
99095
Cambodia
KHM
true
2
1
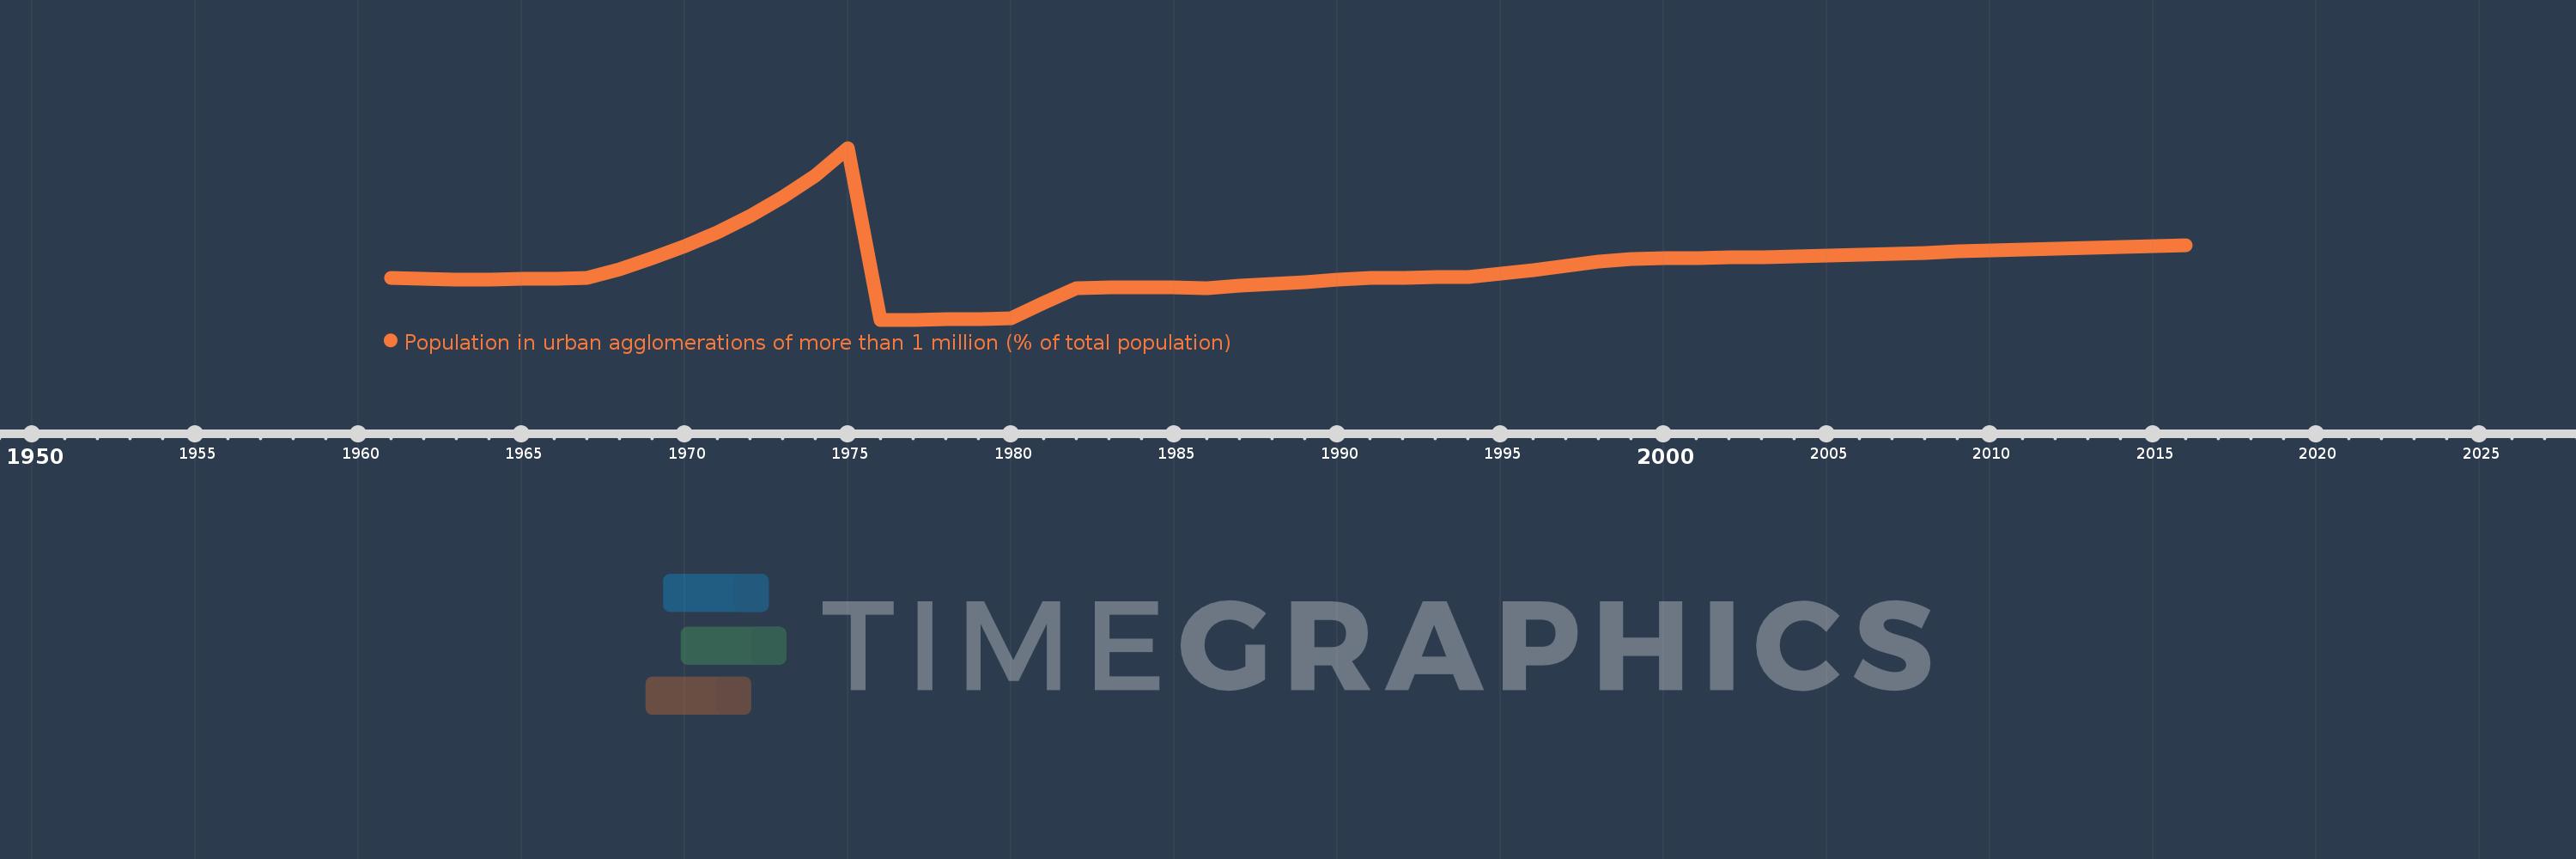
Population in urban agglomerations of more than 1 million (% of total population)
2016,2015,2014,2013,2012,2011,2010,2009,2008,2007,2006,2005,2004,2003,2002,2001,2000,1999,1998,1997,1996,1995,1994,1993,1992,1991,1990,1989,1988,1987,1986,1985,1984,1983,1982,1981,1980,1979,1978,1977,1976,1975,1974,1973,1972,1971,1970,1969,1968,1967,1966,1965,1964,1963,1962,1961
This statistics in other country:
Timeline:
This timeline shows a graph from 1961 to 2016 of Cambodia. No data until 1960. Number of actual observations by date: 56.
Source name:
World Development Indicators
Source organization:
United Nations, World Urbanization Prospects.
Categories, topics:
Climate Change, Urban Development
Last updated:
apr 23, 2017
Indicators value changes by year
Maximum:
23.873
jan 1, 1975
At the date of observation
Value
Absolute change
Change from previous value
jan 1, 1961
6.803
+6.803
0.0%
jan 1, 1962
6.674
-0.129
-1.9%
jan 1, 1963
6.58
-0.094
-1.4%
jan 1, 1964
6.622
+0.042
0.63%
jan 1, 1965
6.674
+0.053
0.8%
jan 1, 1966
6.742
+0.067
1.01%
jan 1, 1967
6.83
+0.088
1.3%
jan 1, 1968
7.993
+1.163
17.03%
jan 1, 1969
9.367
+1.375
17.2%
jan 1, 1970
10.965
+1.598
17.06%
jan 1, 1971
12.817
+1.852
16.89%
jan 1, 1972
14.943
+2.126
16.59%
jan 1, 1973
17.39
+2.448
16.38%
jan 1, 1974
20.284
+2.894
16.64%
jan 1, 1975
23.873
+3.589
17.69%
jan 1, 1976
1.324
-22.549
-94.45%
jan 1, 1977
1.346
+0.021
1.62%
jan 1, 1978
1.385
+0.039
2.9%
jan 1, 1979
1.432
+0.047
3.43%
jan 1, 1980
1.472
+0.04
2.76%
jan 1, 1981
3.547
+2.075
140.99%
jan 1, 1982
5.517
+1.97
55.55%
jan 1, 1983
5.563
+0.047
0.85%
jan 1, 1984
5.551
-0.012
-0.22%
jan 1, 1985
5.525
-0.026
-0.46%
jan 1, 1986
5.515
-0.011
-0.2%
jan 1, 1987
5.749
+0.234
4.24%
jan 1, 1988
6.005
+0.256
4.46%
jan 1, 1989
6.278
+0.273
4.55%
jan 1, 1990
6.554
+0.276
4.4%
jan 1, 1991
6.827
+0.273
4.16%
jan 1, 1992
6.857
+0.031
0.45%
jan 1, 1993
6.882
+0.024
0.35%
jan 1, 1994
6.905
+0.023
0.34%
jan 1, 1995
7.339
+0.434
6.29%
jan 1, 1996
7.816
+0.477
6.5%
jan 1, 1997
8.342
+0.526
6.73%
jan 1, 1998
8.918
+0.576
6.9%
jan 1, 1999
9.342
+0.425
4.76%
jan 1, 2000
9.37
+0.028
0.3%
jan 1, 2001
9.417
+0.047
0.5%
jan 1, 2002
9.483
+0.065
0.69%
jan 1, 2003
9.566
+0.084
0.88%
jan 1, 2004
9.664
+0.098
1.02%
jan 1, 2005
9.772
+0.108
1.12%
jan 1, 2006
9.886
+0.114
1.16%
jan 1, 2007
10.005
+0.12
1.21%
jan 1, 2008
10.13
+0.125
1.25%
jan 1, 2009
10.258
+0.128
1.26%
jan 1, 2010
10.386
+0.127
1.24%
jan 1, 2011
10.511
+0.125
1.2%
jan 1, 2012
10.632
+0.122
1.16%
jan 1, 2013
10.751
+0.119
1.12%
jan 1, 2014
10.869
+0.118
1.09%
jan 1, 2015
10.988
+0.12
1.1%
jan 1, 2016
11.114
+0.125
1.14%
Ranking of countries by current statistics by years


Comments: