29
/
en
AIzaSyAYiBZKx7MnpbEhh9jyipgxe19OcubqV5w
April 1, 2024
104055
Chad
TCD
true
2
1
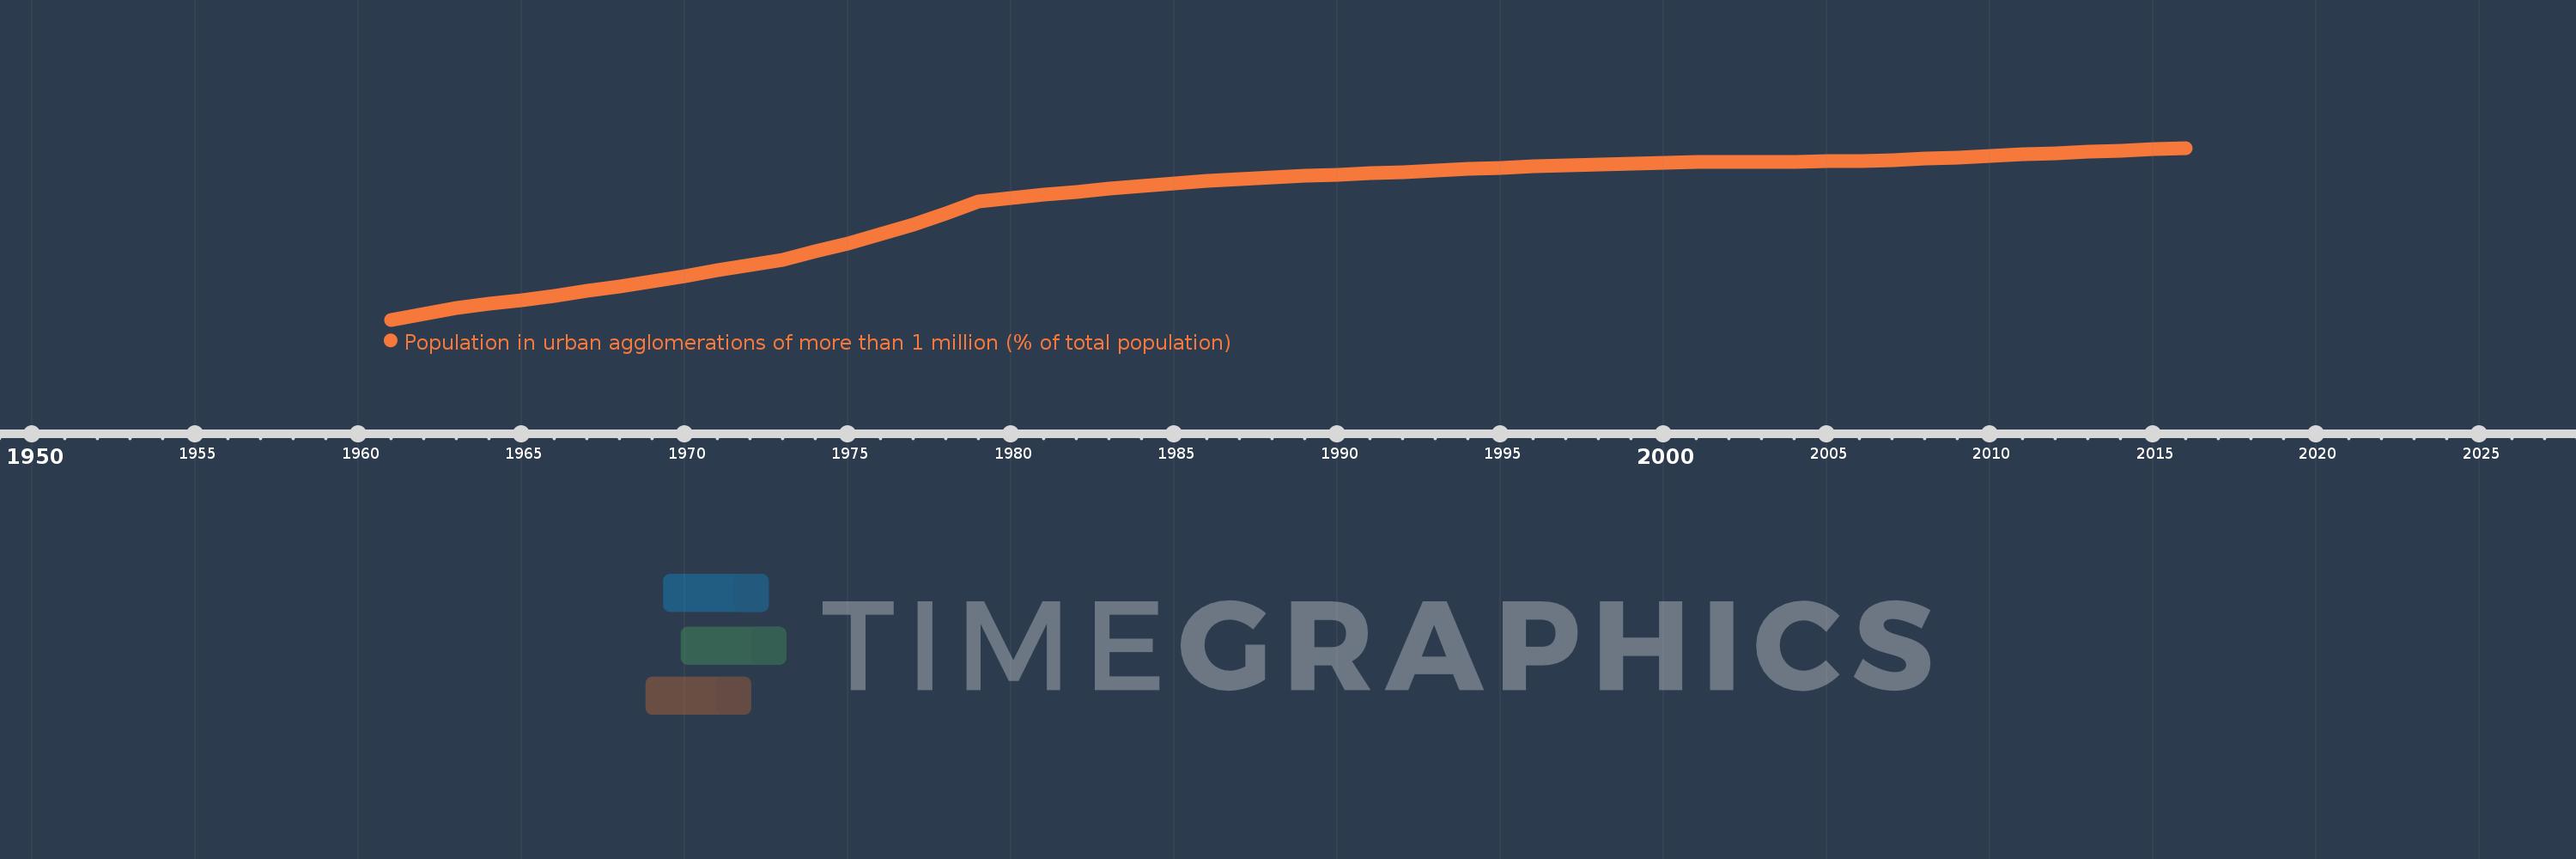
Population in urban agglomerations of more than 1 million (% of total population)
2016,2015,2014,2013,2012,2011,2010,2009,2008,2007,2006,2005,2004,2003,2002,2001,2000,1999,1998,1997,1996,1995,1994,1993,1992,1991,1990,1989,1988,1987,1986,1985,1984,1983,1982,1981,1980,1979,1978,1977,1976,1975,1974,1973,1972,1971,1970,1969,1968,1967,1966,1965,1964,1963,1962,1961
This statistics in other country:
Timeline:
This timeline shows a graph from 1961 to 2016 of Chad. No data until 1960. Number of actual observations by date: 56.
Source name:
World Development Indicators
Source organization:
United Nations, World Urbanization Prospects.
Categories, topics:
Climate Change, Urban Development
Last updated:
apr 23, 2017
Indicators value changes by year
At the date of observation
Value
Absolute change
Change from previous value
jan 1, 1961
2.374
+2.374
0.0%
jan 1, 1962
2.589
+0.215
9.07%
jan 1, 1963
2.824
+0.234
9.05%
jan 1, 1964
2.975
+0.151
5.35%
jan 1, 1965
3.134
+0.159
5.34%
jan 1, 1966
3.298
+0.165
5.26%
jan 1, 1967
3.474
+0.175
5.32%
jan 1, 1968
3.66
+0.186
5.36%
jan 1, 1969
3.855
+0.196
5.34%
jan 1, 1970
4.057
+0.202
5.23%
jan 1, 1971
4.264
+0.207
5.1%
jan 1, 1972
4.475
+0.211
4.94%
jan 1, 1973
4.69
+0.216
4.82%
jan 1, 1974
4.989
+0.299
6.37%
jan 1, 1975
5.311
+0.322
6.46%
jan 1, 1976
5.662
+0.351
6.6%
jan 1, 1977
6.045
+0.383
6.77%
jan 1, 1978
6.459
+0.414
6.85%
jan 1, 1979
6.905
+0.446
6.9%
jan 1, 1980
7.04
+0.135
1.95%
jan 1, 1981
7.171
+0.131
1.86%
jan 1, 1982
7.295
+0.124
1.74%
jan 1, 1983
7.415
+0.119
1.64%
jan 1, 1984
7.526
+0.111
1.5%
jan 1, 1985
7.626
+0.101
1.34%
jan 1, 1986
7.713
+0.087
1.14%
jan 1, 1987
7.787
+0.073
0.95%
jan 1, 1988
7.848
+0.061
0.78%
jan 1, 1989
7.901
+0.053
0.68%
jan 1, 1990
7.951
+0.05
0.64%
jan 1, 1991
8.004
+0.053
0.66%
jan 1, 1992
8.059
+0.055
0.69%
jan 1, 1993
8.116
+0.057
0.7%
jan 1, 1994
8.171
+0.055
0.68%
jan 1, 1995
8.223
+0.052
0.64%
jan 1, 1996
8.27
+0.047
0.57%
jan 1, 1997
8.313
+0.043
0.52%
jan 1, 1998
8.352
+0.038
0.46%
jan 1, 1999
8.385
+0.033
0.4%
jan 1, 2000
8.411
+0.026
0.31%
jan 1, 2001
8.43
+0.019
0.22%
jan 1, 2002
8.44
+0.01
0.12%
jan 1, 2003
8.444
+0.005
0.06%
jan 1, 2004
8.449
+0.005
0.06%
jan 1, 2005
8.462
+0.012
0.15%
jan 1, 2006
8.485
+0.023
0.27%
jan 1, 2007
8.52
+0.035
0.42%
jan 1, 2008
8.565
+0.045
0.53%
jan 1, 2009
8.617
+0.052
0.61%
jan 1, 2010
8.67
+0.053
0.61%
jan 1, 2011
8.721
+0.051
0.59%
jan 1, 2012
8.77
+0.049
0.56%
jan 1, 2013
8.819
+0.049
0.56%
jan 1, 2014
8.869
+0.049
0.56%
jan 1, 2015
8.921
+0.052
0.59%
jan 1, 2016
8.977
+0.056
0.63%
Ranking of countries by current statistics by years


Comments: