29
/
en
AIzaSyAYiBZKx7MnpbEhh9jyipgxe19OcubqV5w
April 1, 2024
55083
Post-demographic dividend
PST
false
2
1
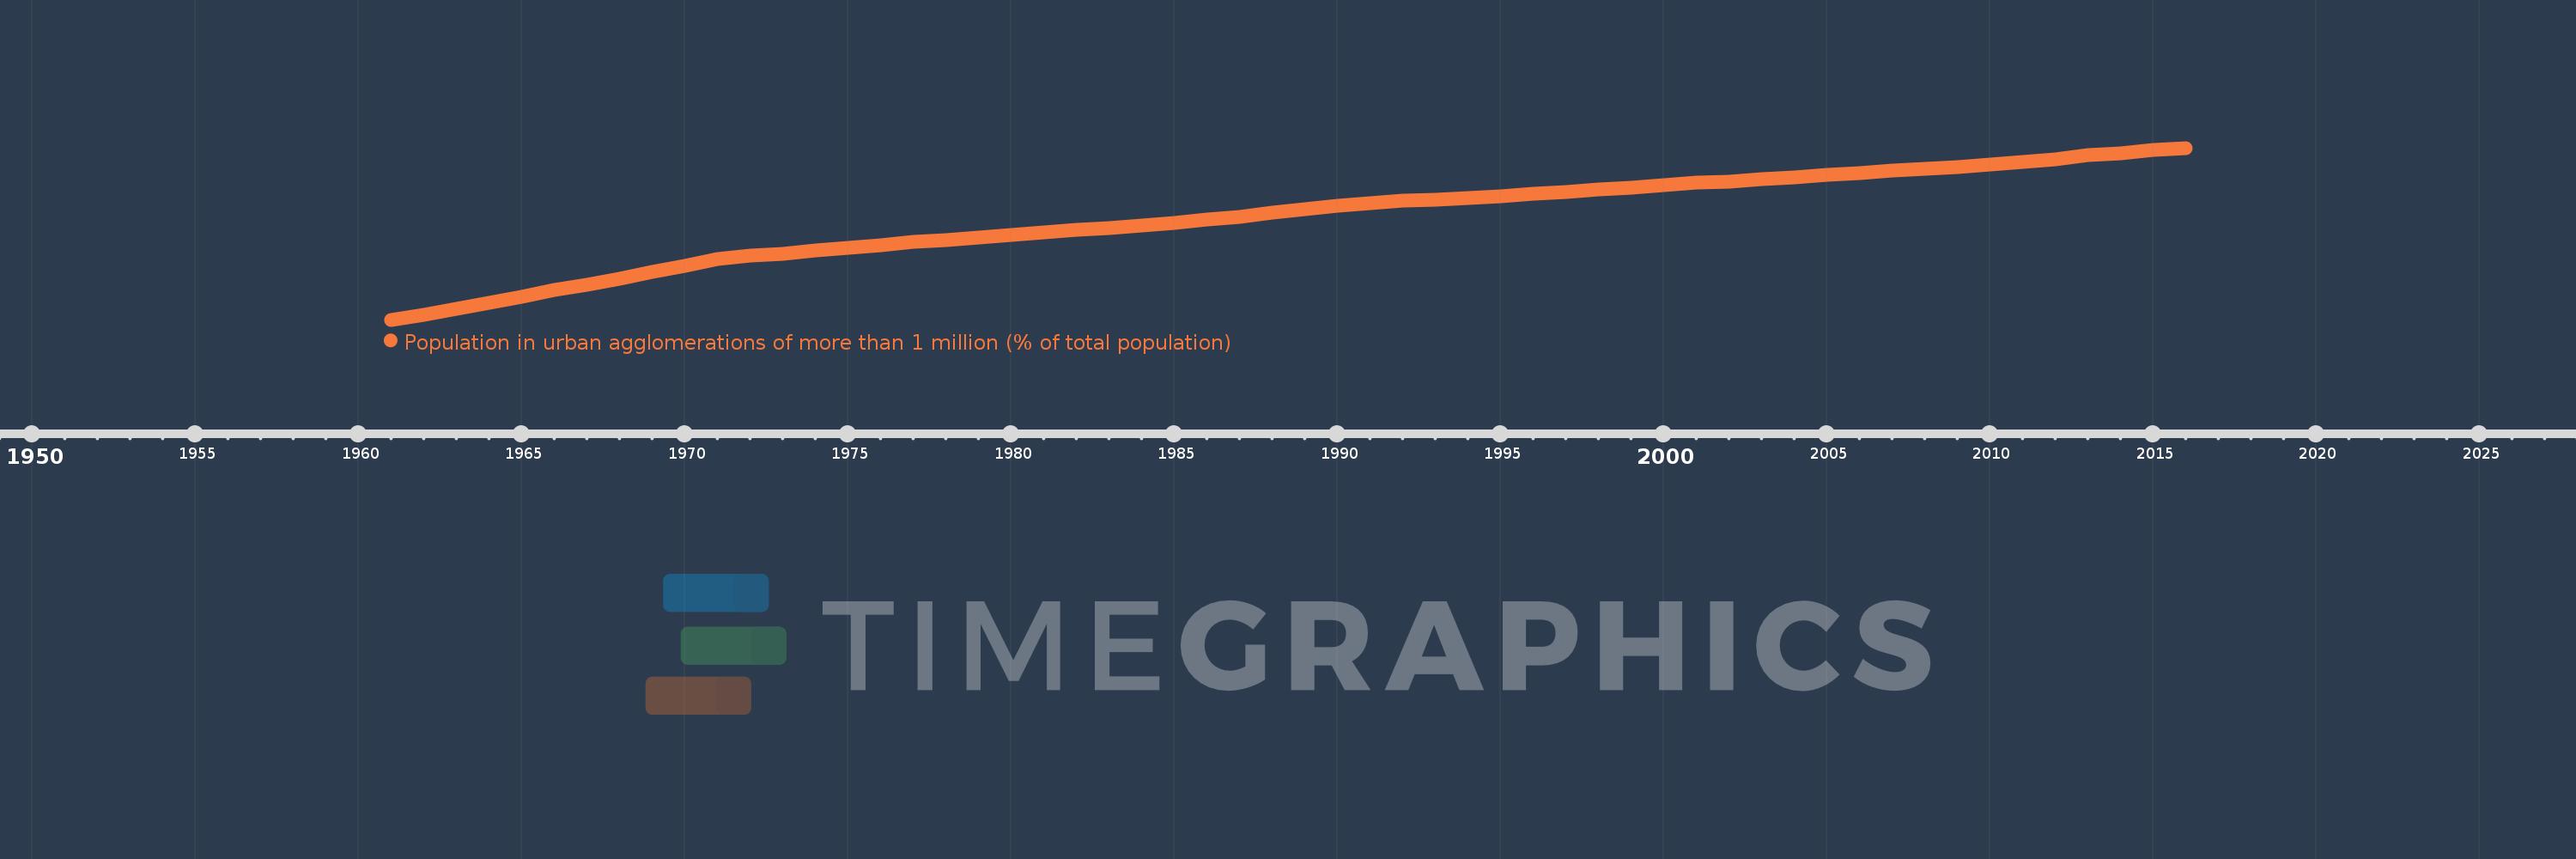
Population in urban agglomerations of more than 1 million (% of total population)
2016,2015,2014,2013,2012,2011,2010,2009,2008,2007,2006,2005,2004,2003,2002,2001,2000,1999,1998,1997,1996,1995,1994,1993,1992,1991,1990,1989,1988,1987,1986,1985,1984,1983,1982,1981,1980,1979,1978,1977,1976,1975,1974,1973,1972,1971,1970,1969,1968,1967,1966,1965,1964,1963,1962,1961
This statistics in other country:
Timeline:
This timeline shows a graph from 1961 to 2016 of Post-demographic dividend. No data until 1960. Number of actual observations by date: 56.
Source name:
World Development Indicators
Source organization:
United Nations, World Urbanization Prospects.
Categories, topics:
Climate Change, Urban Development
Last updated:
apr 23, 2017
Indicators value changes by year
Minimum:
26.328
jan 1, 1961
Maximum:
36.427
jan 1, 2016
At the date of observation
Value
Absolute change
Change from previous value
jan 1, 1961
26.328
+26.328
0.0%
jan 1, 1962
26.619
+0.291
1.1%
jan 1, 1963
26.952
+0.334
1.25%
jan 1, 1964
27.299
+0.346
1.28%
jan 1, 1965
27.666
+0.368
1.35%
jan 1, 1966
28.055
+0.389
1.41%
jan 1, 1967
28.389
+0.334
1.19%
jan 1, 1968
28.746
+0.357
1.26%
jan 1, 1969
29.154
+0.408
1.42%
jan 1, 1970
29.511
+0.357
1.22%
jan 1, 1971
29.885
+0.374
1.27%
jan 1, 1972
30.091
+0.206
0.69%
jan 1, 1973
30.222
+0.131
0.44%
jan 1, 1974
30.394
+0.171
0.57%
jan 1, 1975
30.541
+0.148
0.49%
jan 1, 1976
30.717
+0.175
0.57%
jan 1, 1977
30.883
+0.166
0.54%
jan 1, 1978
31.022
+0.14
0.45%
jan 1, 1979
31.166
+0.144
0.46%
jan 1, 1980
31.309
+0.143
0.46%
jan 1, 1981
31.468
+0.159
0.51%
jan 1, 1982
31.6
+0.132
0.42%
jan 1, 1983
31.73
+0.13
0.41%
jan 1, 1984
31.877
+0.146
0.46%
jan 1, 1985
32.038
+0.162
0.51%
jan 1, 1986
32.207
+0.169
0.53%
jan 1, 1987
32.394
+0.187
0.58%
jan 1, 1988
32.625
+0.231
0.71%
jan 1, 1989
32.818
+0.193
0.59%
jan 1, 1990
33.009
+0.192
0.58%
jan 1, 1991
33.193
+0.184
0.56%
jan 1, 1992
33.312
+0.119
0.36%
jan 1, 1993
33.386
+0.074
0.22%
jan 1, 1994
33.48
+0.094
0.28%
jan 1, 1995
33.601
+0.12
0.36%
jan 1, 1996
33.738
+0.137
0.41%
jan 1, 1997
33.855
+0.117
0.35%
jan 1, 1998
33.978
+0.123
0.36%
jan 1, 1999
34.114
+0.135
0.4%
jan 1, 2000
34.257
+0.143
0.42%
jan 1, 2001
34.376
+0.119
0.35%
jan 1, 2002
34.464
+0.088
0.26%
jan 1, 2003
34.584
+0.12
0.35%
jan 1, 2004
34.709
+0.125
0.36%
jan 1, 2005
34.832
+0.123
0.36%
jan 1, 2006
34.967
+0.134
0.39%
jan 1, 2007
35.089
+0.122
0.35%
jan 1, 2008
35.202
+0.114
0.32%
jan 1, 2009
35.301
+0.098
0.28%
jan 1, 2010
35.434
+0.134
0.38%
jan 1, 2011
35.587
+0.152
0.43%
jan 1, 2012
35.757
+0.17
0.48%
jan 1, 2013
35.984
+0.228
0.64%
jan 1, 2014
36.105
+0.121
0.33%
jan 1, 2015
36.315
+0.21
0.58%
jan 1, 2016
36.427
+0.112
0.31%
Ranking of countries by current statistics by years


Comments: