29
/
en
AIzaSyAYiBZKx7MnpbEhh9jyipgxe19OcubqV5w
April 1, 2024
224092
Philippines
PHL
true
2
1
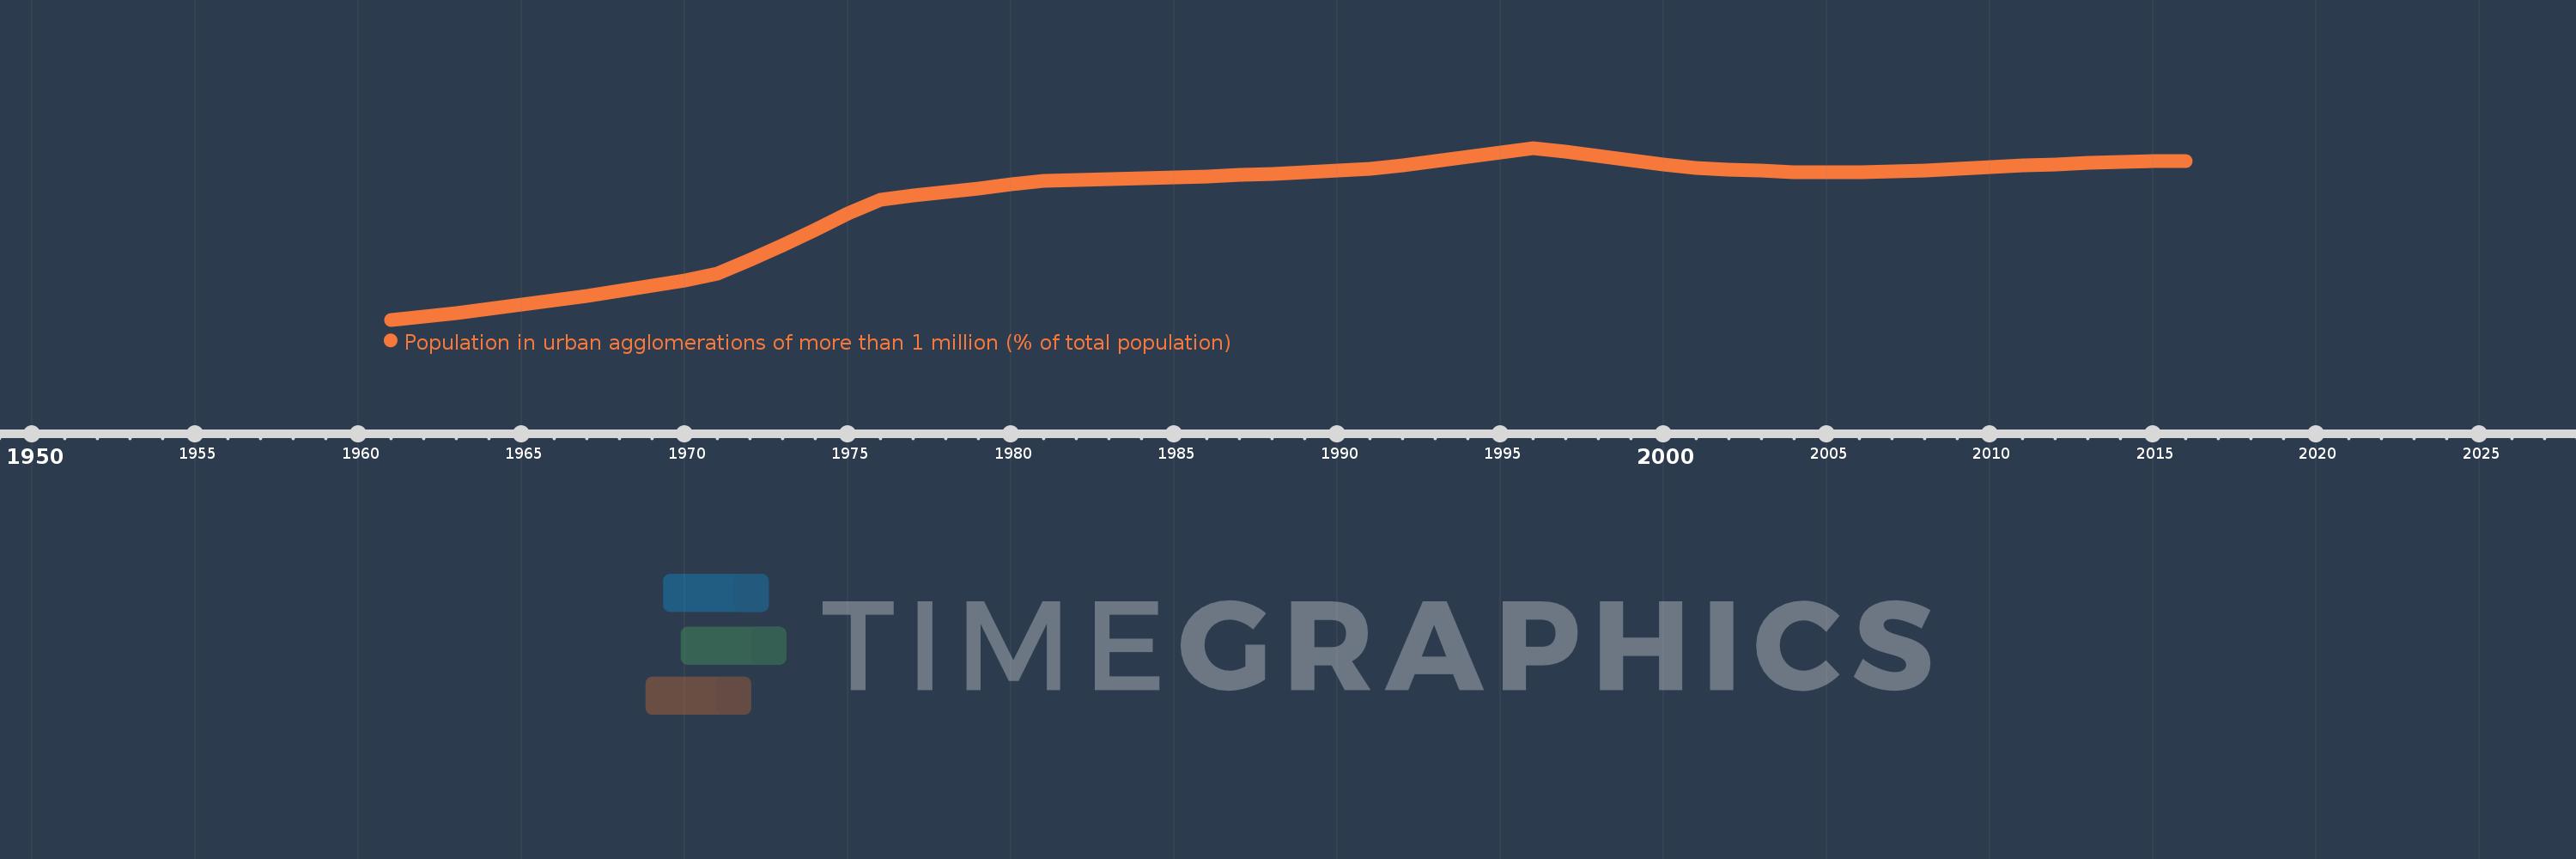
Population in urban agglomerations of more than 1 million (% of total population)
2016,2015,2014,2013,2012,2011,2010,2009,2008,2007,2006,2005,2004,2003,2002,2001,2000,1999,1998,1997,1996,1995,1994,1993,1992,1991,1990,1989,1988,1987,1986,1985,1984,1983,1982,1981,1980,1979,1978,1977,1976,1975,1974,1973,1972,1971,1970,1969,1968,1967,1966,1965,1964,1963,1962,1961
This statistics in other country:
Timeline:
This timeline shows a graph from 1961 to 2016 of Philippines. No data until 1960. Number of actual observations by date: 56.
Source name:
World Development Indicators
Source organization:
United Nations, World Urbanization Prospects.
Categories, topics:
Climate Change, Urban Development
Last updated:
apr 23, 2017
Indicators value changes by year
Maximum:
14.896
jan 1, 1996
At the date of observation
Value
Absolute change
Change from previous value
jan 1, 1961
9.531
+9.531
0.0%
jan 1, 1962
9.639
+0.108
1.13%
jan 1, 1963
9.75
+0.111
1.16%
jan 1, 1964
9.867
+0.117
1.2%
jan 1, 1965
9.993
+0.126
1.28%
jan 1, 1966
10.127
+0.135
1.35%
jan 1, 1967
10.274
+0.146
1.44%
jan 1, 1968
10.43
+0.156
1.52%
jan 1, 1969
10.594
+0.165
1.58%
jan 1, 1970
10.763
+0.169
1.59%
jan 1, 1971
10.974
+0.211
1.96%
jan 1, 1972
11.41
+0.436
3.97%
jan 1, 1973
11.866
+0.456
3.99%
jan 1, 1974
12.34
+0.474
4.0%
jan 1, 1975
12.838
+0.498
4.03%
jan 1, 1976
13.289
+0.451
3.52%
jan 1, 1977
13.4
+0.111
0.84%
jan 1, 1978
13.515
+0.114
0.85%
jan 1, 1979
13.633
+0.118
0.87%
jan 1, 1980
13.752
+0.12
0.88%
jan 1, 1981
13.858
+0.106
0.77%
jan 1, 1982
13.886
+0.028
0.2%
jan 1, 1983
13.916
+0.029
0.21%
jan 1, 1984
13.946
+0.03
0.22%
jan 1, 1985
13.979
+0.033
0.23%
jan 1, 1986
14.013
+0.034
0.24%
jan 1, 1987
14.049
+0.037
0.26%
jan 1, 1988
14.089
+0.04
0.28%
jan 1, 1989
14.134
+0.045
0.32%
jan 1, 1990
14.184
+0.05
0.35%
jan 1, 1991
14.25
+0.066
0.46%
jan 1, 1992
14.363
+0.113
0.8%
jan 1, 1993
14.485
+0.122
0.85%
jan 1, 1994
14.615
+0.129
0.89%
jan 1, 1995
14.752
+0.137
0.94%
jan 1, 1996
14.896
+0.144
0.98%
jan 1, 1997
14.794
-0.102
-0.69%
jan 1, 1998
14.647
-0.146
-0.99%
jan 1, 1999
14.508
-0.139
-0.95%
jan 1, 2000
14.375
-0.133
-0.92%
jan 1, 2001
14.26
-0.114
-0.8%
jan 1, 2002
14.218
-0.042
-0.3%
jan 1, 2003
14.18
-0.038
-0.27%
jan 1, 2004
14.15
-0.03
-0.21%
jan 1, 2005
14.135
-0.015
-0.11%
jan 1, 2006
14.137
+0.003
0.02%
jan 1, 2007
14.16
+0.023
0.16%
jan 1, 2008
14.199
+0.039
0.28%
jan 1, 2009
14.249
+0.05
0.35%
jan 1, 2010
14.299
+0.05
0.35%
jan 1, 2011
14.345
+0.046
0.32%
jan 1, 2012
14.384
+0.039
0.27%
jan 1, 2013
14.419
+0.035
0.24%
jan 1, 2014
14.451
+0.033
0.23%
jan 1, 2015
14.486
+0.035
0.24%
jan 1, 2016
14.475
-0.012
-0.08%
Ranking of countries by current statistics by years


Comments: