29
/
en
AIzaSyAYiBZKx7MnpbEhh9jyipgxe19OcubqV5w
April 1, 2024
225289
Poland
POL
true
2
1
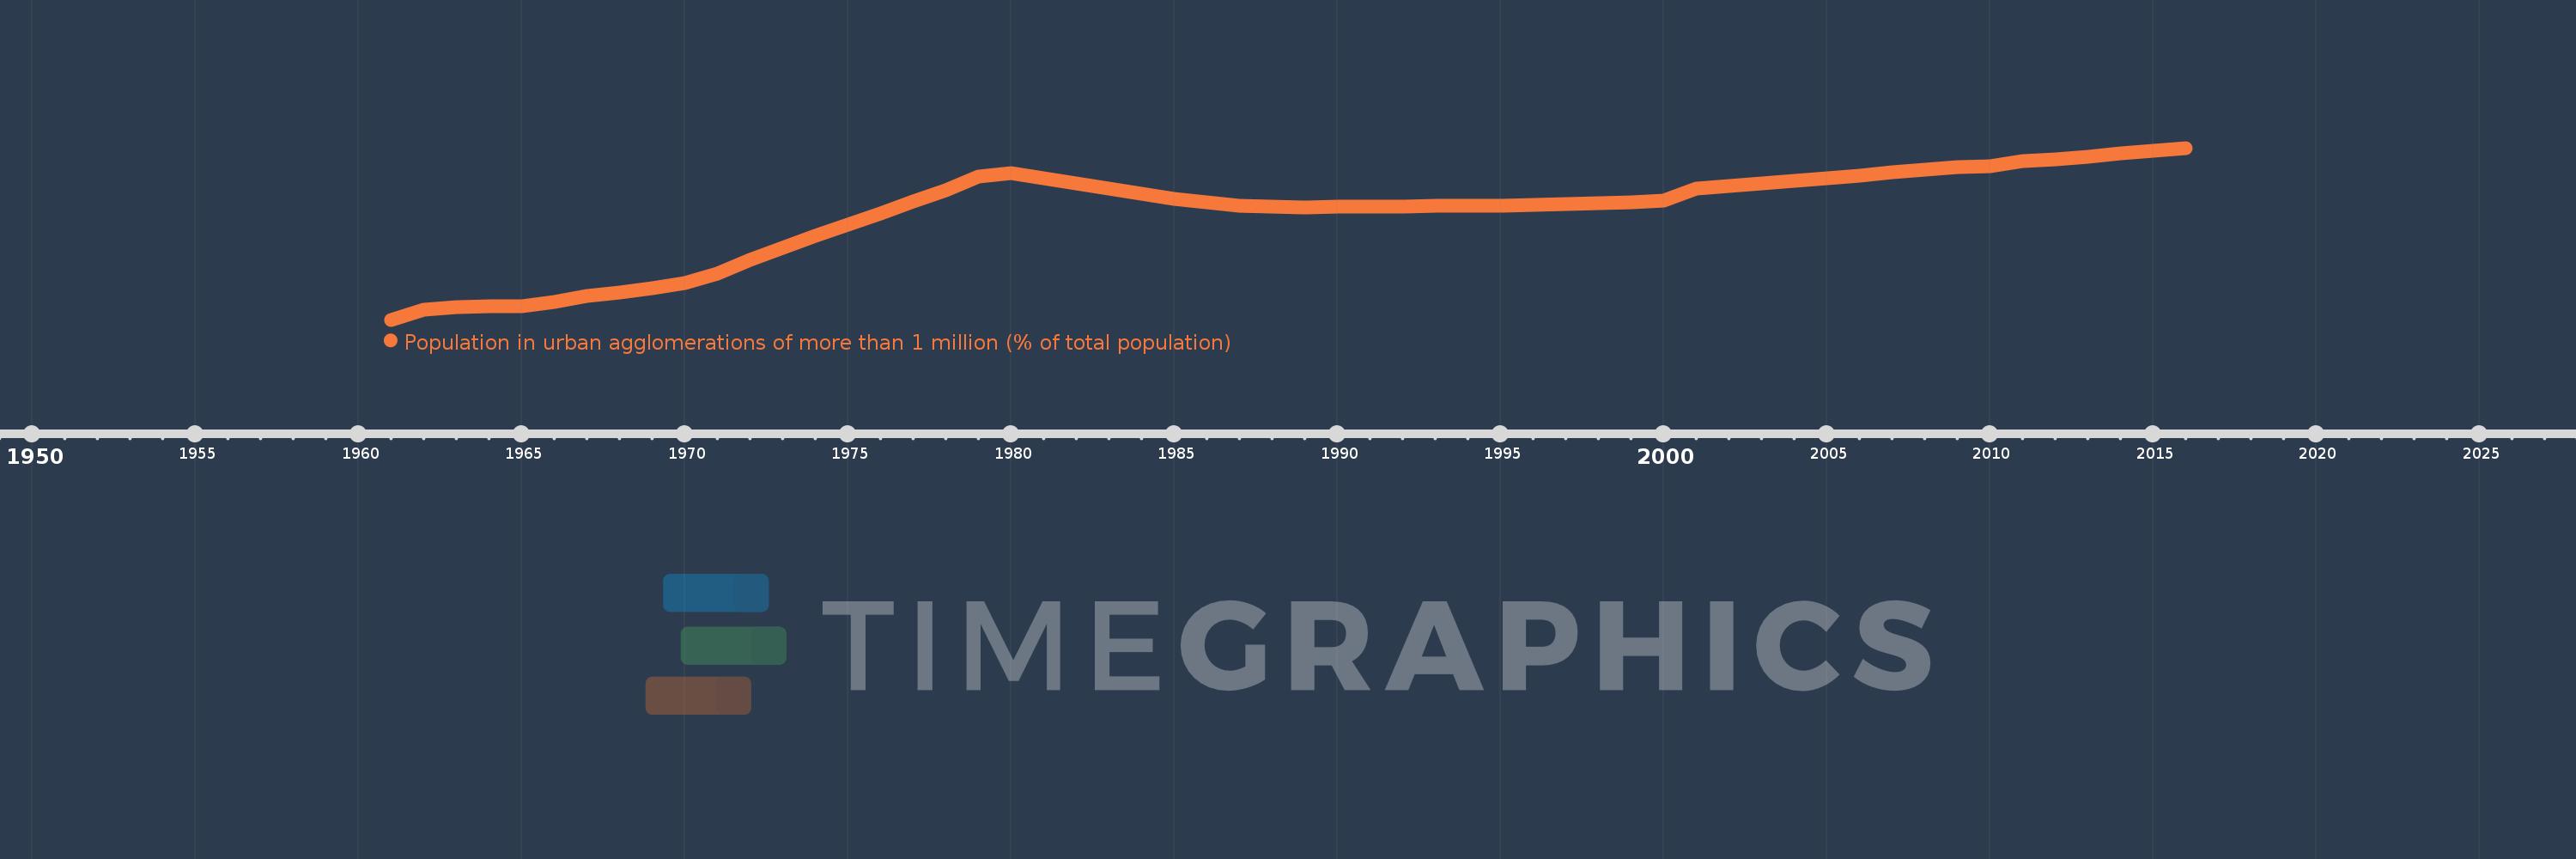
Population in urban agglomerations of more than 1 million (% of total population)
2016,2015,2014,2013,2012,2011,2010,2009,2008,2007,2006,2005,2004,2003,2002,2001,2000,1999,1998,1997,1996,1995,1994,1993,1992,1991,1990,1989,1988,1987,1986,1985,1984,1983,1982,1981,1980,1979,1978,1977,1976,1975,1974,1973,1972,1971,1970,1969,1968,1967,1966,1965,1964,1963,1962,1961
This statistics in other country:
Timeline:
This timeline shows a graph from 1961 to 2016 of Poland. No data until 1960. Number of actual observations by date: 56.
Source name:
World Development Indicators
Source organization:
United Nations, World Urbanization Prospects.
Categories, topics:
Climate Change, Urban Development
Last updated:
apr 23, 2017
Indicators value changes by year
At the date of observation
Value
Absolute change
Change from previous value
jan 1, 1961
3.776
+3.776
0.0%
jan 1, 1962
3.822
+0.045
1.2%
jan 1, 1963
3.832
+0.01
0.27%
jan 1, 1964
3.835
+0.003
0.09%
jan 1, 1965
3.836
+0.001
0.03%
jan 1, 1966
3.853
+0.017
0.43%
jan 1, 1967
3.879
+0.026
0.66%
jan 1, 1968
3.896
+0.017
0.45%
jan 1, 1969
3.914
+0.018
0.46%
jan 1, 1970
3.938
+0.025
0.63%
jan 1, 1971
3.98
+0.042
1.06%
jan 1, 1972
4.039
+0.059
1.48%
jan 1, 1973
4.094
+0.055
1.35%
jan 1, 1974
4.145
+0.052
1.26%
jan 1, 1975
4.195
+0.05
1.21%
jan 1, 1976
4.245
+0.049
1.18%
jan 1, 1977
4.295
+0.05
1.18%
jan 1, 1978
4.347
+0.052
1.21%
jan 1, 1979
4.407
+0.06
1.38%
jan 1, 1980
4.423
+0.016
0.37%
jan 1, 1981
4.399
-0.023
-0.53%
jan 1, 1982
4.377
-0.022
-0.51%
jan 1, 1983
4.354
-0.023
-0.52%
jan 1, 1984
4.331
-0.024
-0.54%
jan 1, 1985
4.309
-0.022
-0.51%
jan 1, 1986
4.291
-0.018
-0.41%
jan 1, 1987
4.279
-0.012
-0.28%
jan 1, 1988
4.272
-0.007
-0.17%
jan 1, 1989
4.271
-0.001
-0.02%
jan 1, 1990
4.272
+0.001
0.03%
jan 1, 1991
4.273
+0.0
0.0%
jan 1, 1992
4.274
+0.002
0.04%
jan 1, 1993
4.278
+0.004
0.09%
jan 1, 1994
4.279
+0.001
0.03%
jan 1, 1995
4.278
-0.002
-0.04%
jan 1, 1996
4.28
+0.002
0.04%
jan 1, 1997
4.284
+0.004
0.1%
jan 1, 1998
4.288
+0.005
0.11%
jan 1, 1999
4.294
+0.006
0.14%
jan 1, 2000
4.302
+0.008
0.18%
jan 1, 2001
4.355
+0.053
1.23%
jan 1, 2002
4.364
+0.009
0.2%
jan 1, 2003
4.374
+0.01
0.23%
jan 1, 2004
4.387
+0.013
0.29%
jan 1, 2005
4.399
+0.013
0.29%
jan 1, 2006
4.411
+0.012
0.27%
jan 1, 2007
4.424
+0.013
0.29%
jan 1, 2008
4.436
+0.012
0.28%
jan 1, 2009
4.446
+0.009
0.21%
jan 1, 2010
4.453
+0.007
0.16%
jan 1, 2011
4.476
+0.023
0.51%
jan 1, 2012
4.483
+0.008
0.17%
jan 1, 2013
4.494
+0.01
0.23%
jan 1, 2014
4.507
+0.013
0.29%
jan 1, 2015
4.52
+0.014
0.3%
jan 1, 2016
4.532
+0.012
0.27%
Ranking of countries by current statistics by years


Comments: