29
/
en
AIzaSyAYiBZKx7MnpbEhh9jyipgxe19OcubqV5w
April 1, 2024
116162
Cuba
CUB
true
2
1
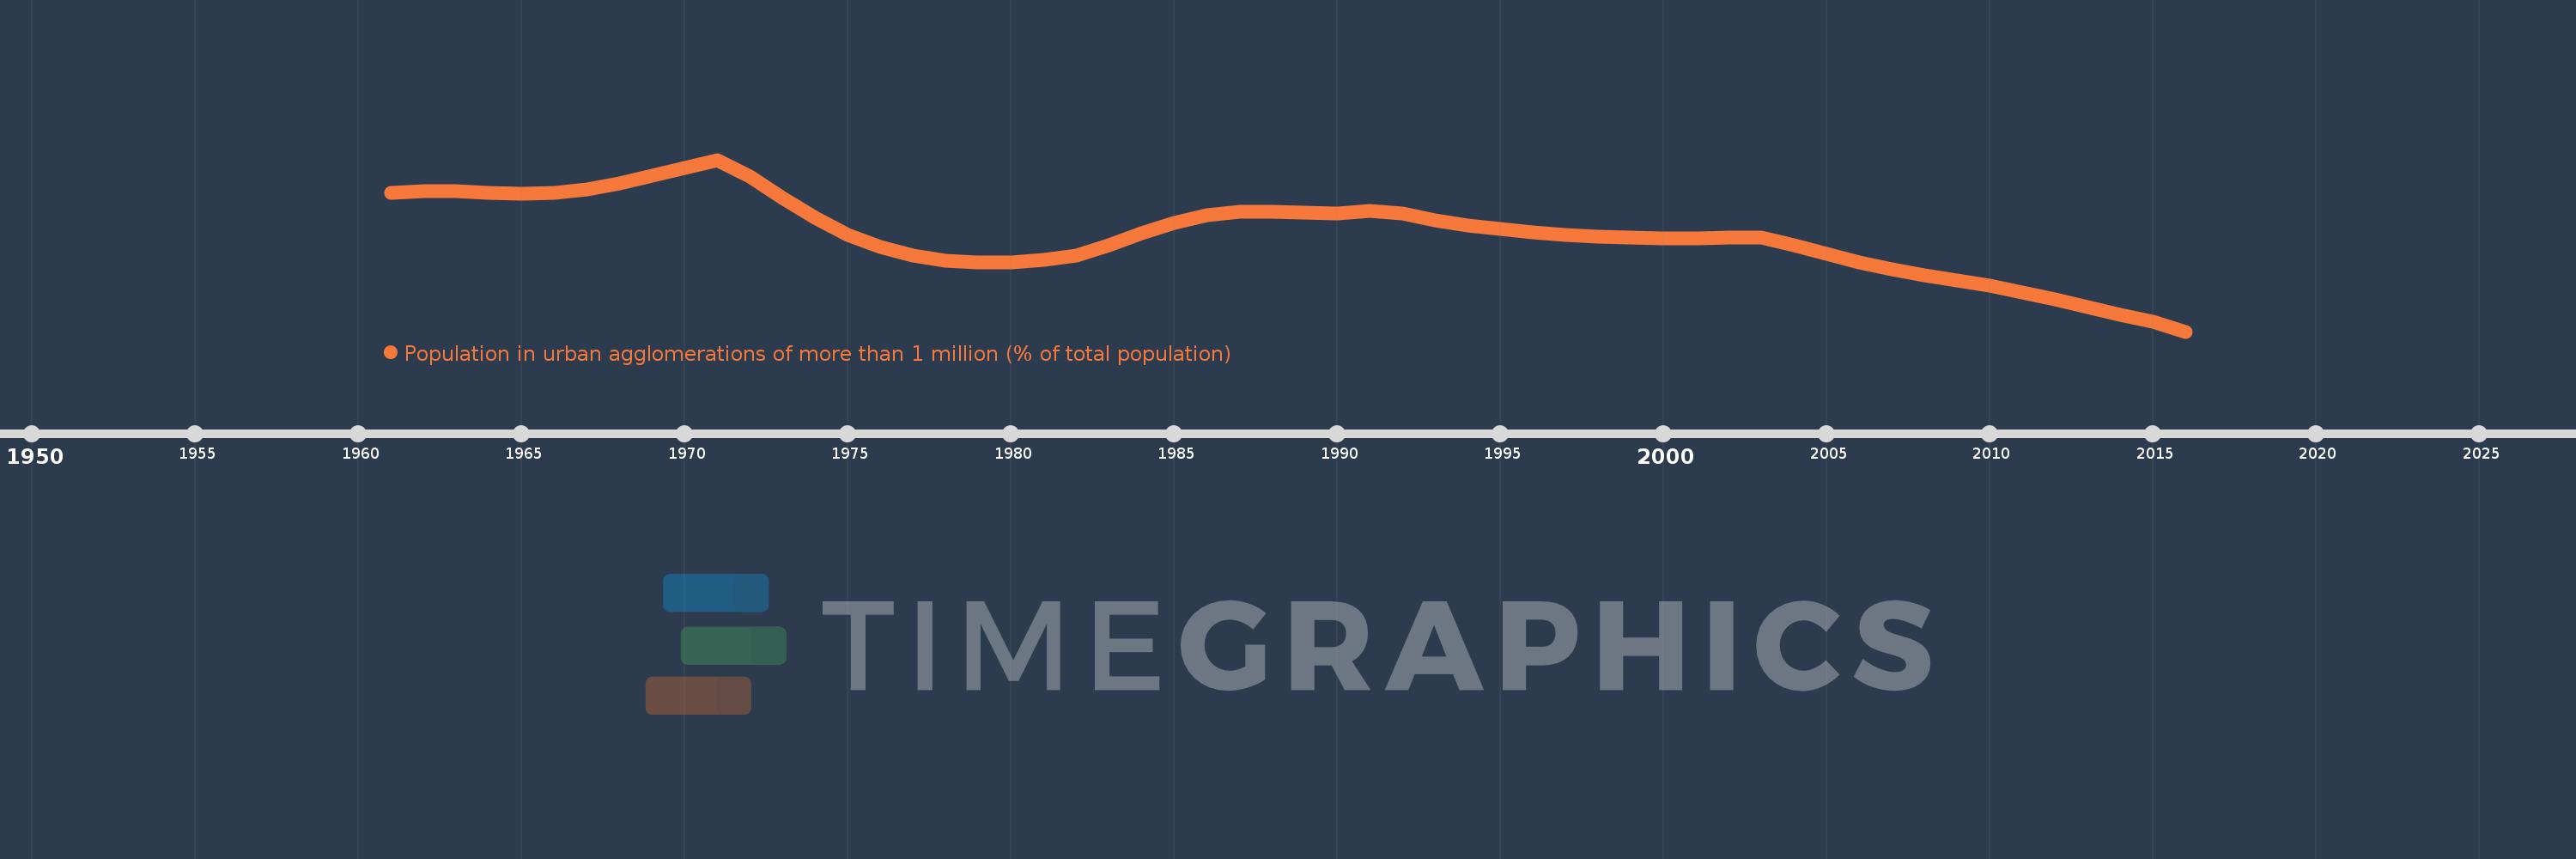
Population in urban agglomerations of more than 1 million (% of total population)
2016,2015,2014,2013,2012,2011,2010,2009,2008,2007,2006,2005,2004,2003,2002,2001,2000,1999,1998,1997,1996,1995,1994,1993,1992,1991,1990,1989,1988,1987,1986,1985,1984,1983,1982,1981,1980,1979,1978,1977,1976,1975,1974,1973,1972,1971,1970,1969,1968,1967,1966,1965,1964,1963,1962,1961
This statistics in other country:
Timeline:
This timeline shows a graph from 1961 to 2016 of Cuba. No data until 1960. Number of actual observations by date: 56.
Source name:
World Development Indicators
Source organization:
United Nations, World Urbanization Prospects.
Categories, topics:
Climate Change, Urban Development
Last updated:
apr 23, 2017
Indicators value changes by year
Minimum:
18.764
jan 1, 2016
Maximum:
20.418
jan 1, 1971
At the date of observation
Value
Absolute change
Change from previous value
jan 1, 1961
20.102
+20.102
0.0%
jan 1, 1962
20.119
+0.017
0.08%
jan 1, 1963
20.113
-0.006
-0.03%
jan 1, 1964
20.097
-0.016
-0.08%
jan 1, 1965
20.089
-0.008
-0.04%
jan 1, 1966
20.099
+0.01
0.05%
jan 1, 1967
20.134
+0.035
0.17%
jan 1, 1968
20.19
+0.056
0.28%
jan 1, 1969
20.262
+0.072
0.36%
jan 1, 1970
20.339
+0.077
0.38%
jan 1, 1971
20.418
+0.079
0.39%
jan 1, 1972
20.256
-0.162
-0.79%
jan 1, 1973
20.048
-0.209
-1.03%
jan 1, 1974
19.856
-0.191
-0.95%
jan 1, 1975
19.697
-0.16
-0.8%
jan 1, 1976
19.576
-0.121
-0.61%
jan 1, 1977
19.495
-0.081
-0.41%
jan 1, 1978
19.447
-0.048
-0.24%
jan 1, 1979
19.429
-0.018
-0.09%
jan 1, 1980
19.433
+0.004
0.02%
jan 1, 1981
19.454
+0.021
0.11%
jan 1, 1982
19.493
+0.039
0.2%
jan 1, 1983
19.597
+0.103
0.53%
jan 1, 1984
19.714
+0.117
0.6%
jan 1, 1985
19.813
+0.1
0.51%
jan 1, 1986
19.883
+0.07
0.35%
jan 1, 1987
19.916
+0.033
0.17%
jan 1, 1988
19.92
+0.003
0.02%
jan 1, 1989
19.909
-0.011
-0.05%
jan 1, 1990
19.905
-0.004
-0.02%
jan 1, 1991
19.924
+0.019
0.1%
jan 1, 1992
19.903
-0.022
-0.11%
jan 1, 1993
19.835
-0.067
-0.34%
jan 1, 1994
19.786
-0.049
-0.25%
jan 1, 1995
19.749
-0.037
-0.19%
jan 1, 1996
19.718
-0.031
-0.16%
jan 1, 1997
19.694
-0.024
-0.12%
jan 1, 1998
19.677
-0.016
-0.08%
jan 1, 1999
19.668
-0.01
-0.05%
jan 1, 2000
19.663
-0.004
-0.02%
jan 1, 2001
19.663
+0.0
0.0%
jan 1, 2002
19.666
+0.003
0.02%
jan 1, 2003
19.673
+0.006
0.03%
jan 1, 2004
19.597
-0.076
-0.39%
jan 1, 2005
19.509
-0.087
-0.45%
jan 1, 2006
19.432
-0.077
-0.4%
jan 1, 2007
19.366
-0.066
-0.34%
jan 1, 2008
19.309
-0.057
-0.29%
jan 1, 2009
19.257
-0.052
-0.27%
jan 1, 2010
19.203
-0.054
-0.28%
jan 1, 2011
19.143
-0.06
-0.31%
jan 1, 2012
19.076
-0.067
-0.35%
jan 1, 2013
19.003
-0.073
-0.38%
jan 1, 2014
18.929
-0.074
-0.39%
jan 1, 2015
18.86
-0.068
-0.36%
jan 1, 2016
18.764
-0.097
-0.51%
Ranking of countries by current statistics by years


Comments: