29
/
en
AIzaSyAYiBZKx7MnpbEhh9jyipgxe19OcubqV5w
April 1, 2024
146130
Guinea
GIN
true
2
1
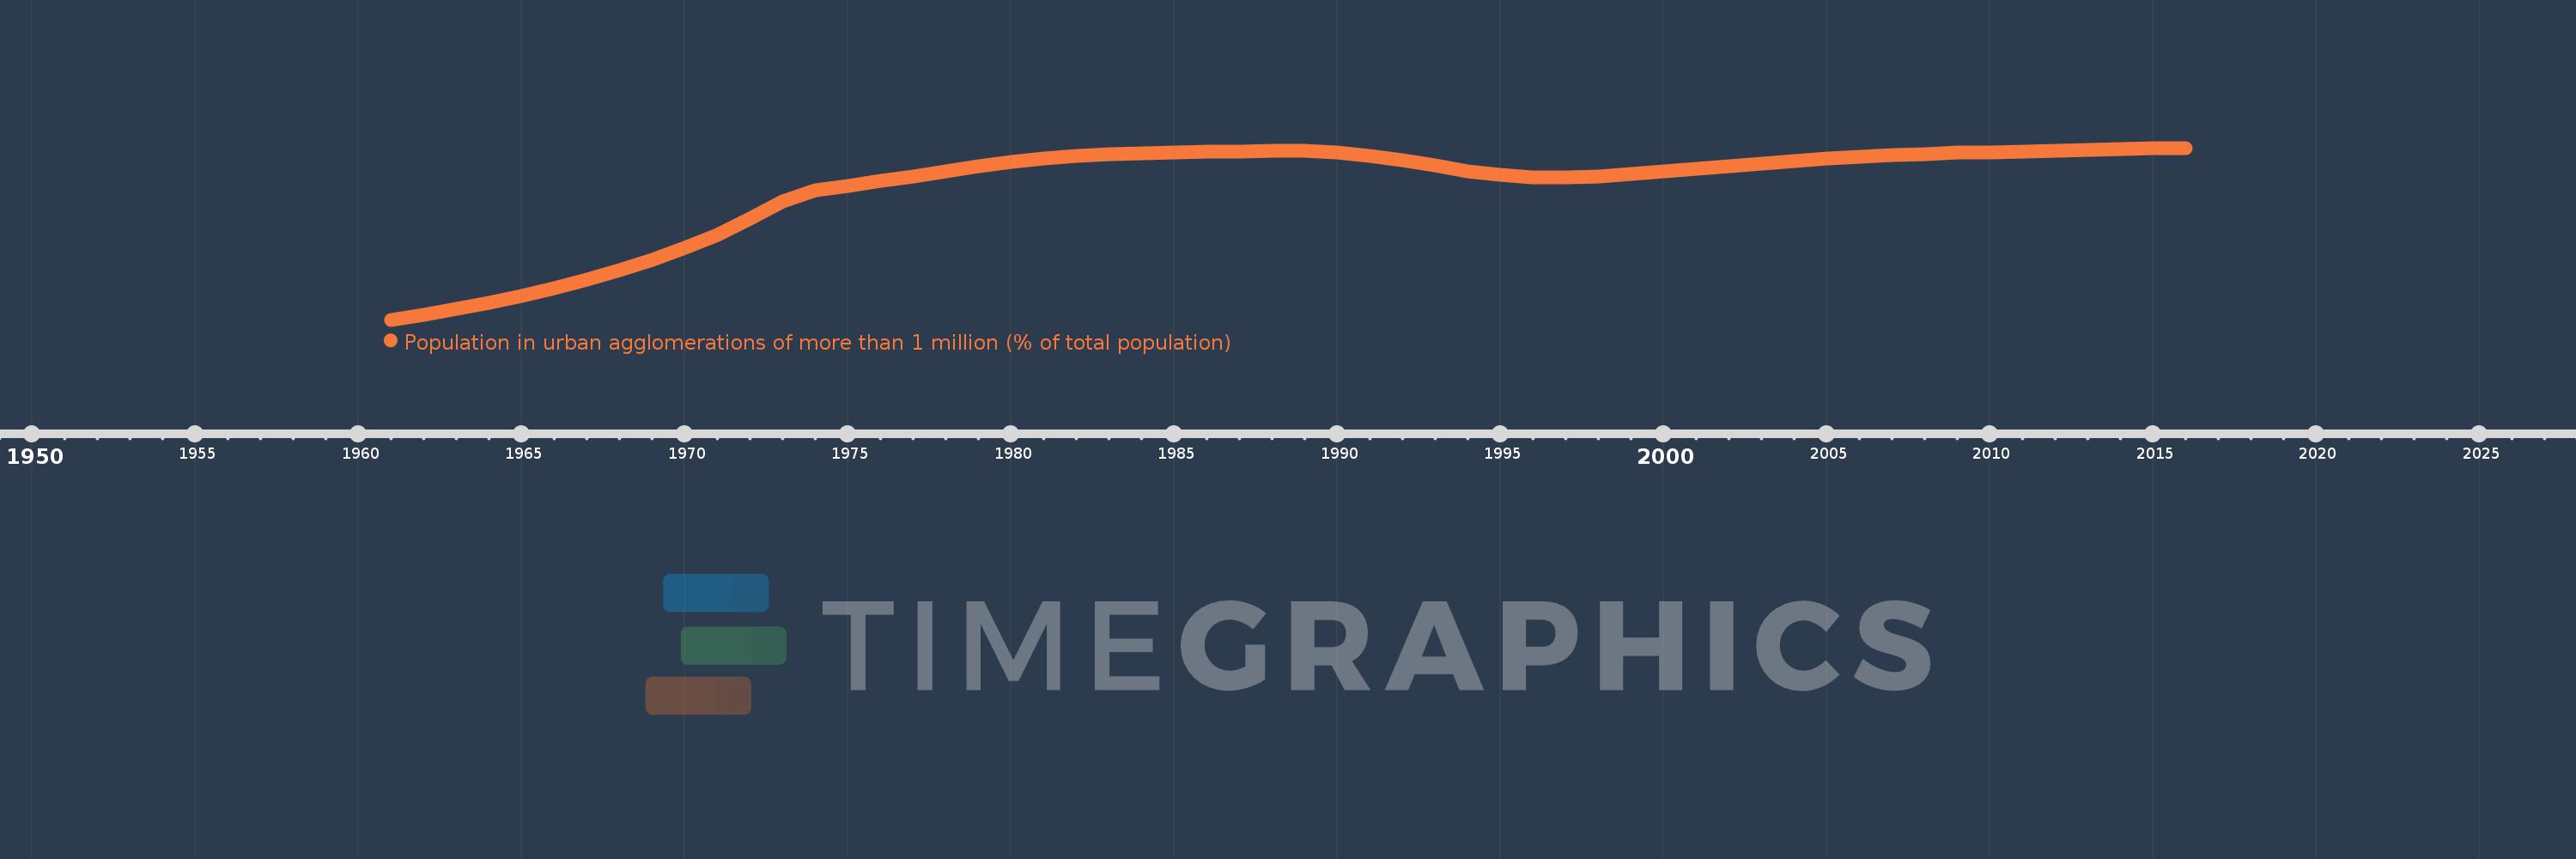
Population in urban agglomerations of more than 1 million (% of total population)
2016,2015,2014,2013,2012,2011,2010,2009,2008,2007,2006,2005,2004,2003,2002,2001,2000,1999,1998,1997,1996,1995,1994,1993,1992,1991,1990,1989,1988,1987,1986,1985,1984,1983,1982,1981,1980,1979,1978,1977,1976,1975,1974,1973,1972,1971,1970,1969,1968,1967,1966,1965,1964,1963,1962,1961
This statistics in other country:
Timeline:
This timeline shows a graph from 1961 to 2016 of Guinea. No data until 1960. Number of actual observations by date: 56.
Source name:
World Development Indicators
Source organization:
United Nations, World Urbanization Prospects.
Categories, topics:
Climate Change, Urban Development
Last updated:
apr 23, 2017
Indicators value changes by year
Maximum:
15.364
jan 1, 2015
At the date of observation
Value
Absolute change
Change from previous value
jan 1, 1961
3.135
+3.135
0.0%
jan 1, 1962
3.493
+0.358
11.43%
jan 1, 1963
3.893
+0.4
11.45%
jan 1, 1964
4.338
+0.445
11.42%
jan 1, 1965
4.832
+0.494
11.38%
jan 1, 1966
5.376
+0.544
11.26%
jan 1, 1967
5.978
+0.601
11.19%
jan 1, 1968
6.643
+0.665
11.13%
jan 1, 1969
7.388
+0.745
11.21%
jan 1, 1970
8.229
+0.842
11.39%
jan 1, 1971
9.194
+0.965
11.73%
jan 1, 1972
10.302
+1.107
12.04%
jan 1, 1973
11.571
+1.27
12.32%
jan 1, 1974
12.368
+0.797
6.89%
jan 1, 1975
12.679
+0.311
2.51%
jan 1, 1976
13.004
+0.326
2.57%
jan 1, 1977
13.345
+0.341
2.62%
jan 1, 1978
13.694
+0.349
2.62%
jan 1, 1979
14.035
+0.341
2.49%
jan 1, 1980
14.343
+0.307
2.19%
jan 1, 1981
14.596
+0.254
1.77%
jan 1, 1982
14.781
+0.185
1.27%
jan 1, 1983
14.9
+0.119
0.8%
jan 1, 1984
14.975
+0.075
0.51%
jan 1, 1985
15.034
+0.059
0.4%
jan 1, 1986
15.077
+0.042
0.28%
jan 1, 1987
15.122
+0.045
0.3%
jan 1, 1988
15.16
+0.038
0.25%
jan 1, 1989
15.151
-0.009
-0.06%
jan 1, 1990
15.045
-0.106
-0.7%
jan 1, 1991
14.825
-0.22
-1.46%
jan 1, 1992
14.494
-0.331
-2.24%
jan 1, 1993
14.101
-0.392
-2.71%
jan 1, 1994
13.724
-0.377
-2.67%
jan 1, 1995
13.443
-0.282
-2.05%
jan 1, 1996
13.291
-0.151
-1.13%
jan 1, 1997
13.27
-0.021
-0.16%
jan 1, 1998
13.349
+0.079
0.6%
jan 1, 1999
13.501
+0.152
1.14%
jan 1, 2000
13.686
+0.185
1.37%
jan 1, 2001
13.874
+0.188
1.38%
jan 1, 2002
14.062
+0.188
1.35%
jan 1, 2003
14.253
+0.191
1.36%
jan 1, 2004
14.438
+0.185
1.3%
jan 1, 2005
14.605
+0.167
1.16%
jan 1, 2006
14.748
+0.143
0.98%
jan 1, 2007
14.861
+0.113
0.77%
jan 1, 2008
14.946
+0.085
0.57%
jan 1, 2009
15.011
+0.065
0.44%
jan 1, 2010
15.068
+0.057
0.38%
jan 1, 2011
15.125
+0.057
0.38%
jan 1, 2012
15.183
+0.058
0.38%
jan 1, 2013
15.241
+0.058
0.38%
jan 1, 2014
15.301
+0.06
0.39%
jan 1, 2015
15.364
+0.063
0.41%
jan 1, 2016
15.355
-0.009
-0.06%
Ranking of countries by current statistics by years


Comments: