29
/
en
AIzaSyAYiBZKx7MnpbEhh9jyipgxe19OcubqV5w
April 1, 2024
140902
Ghana
GHA
true
2
1
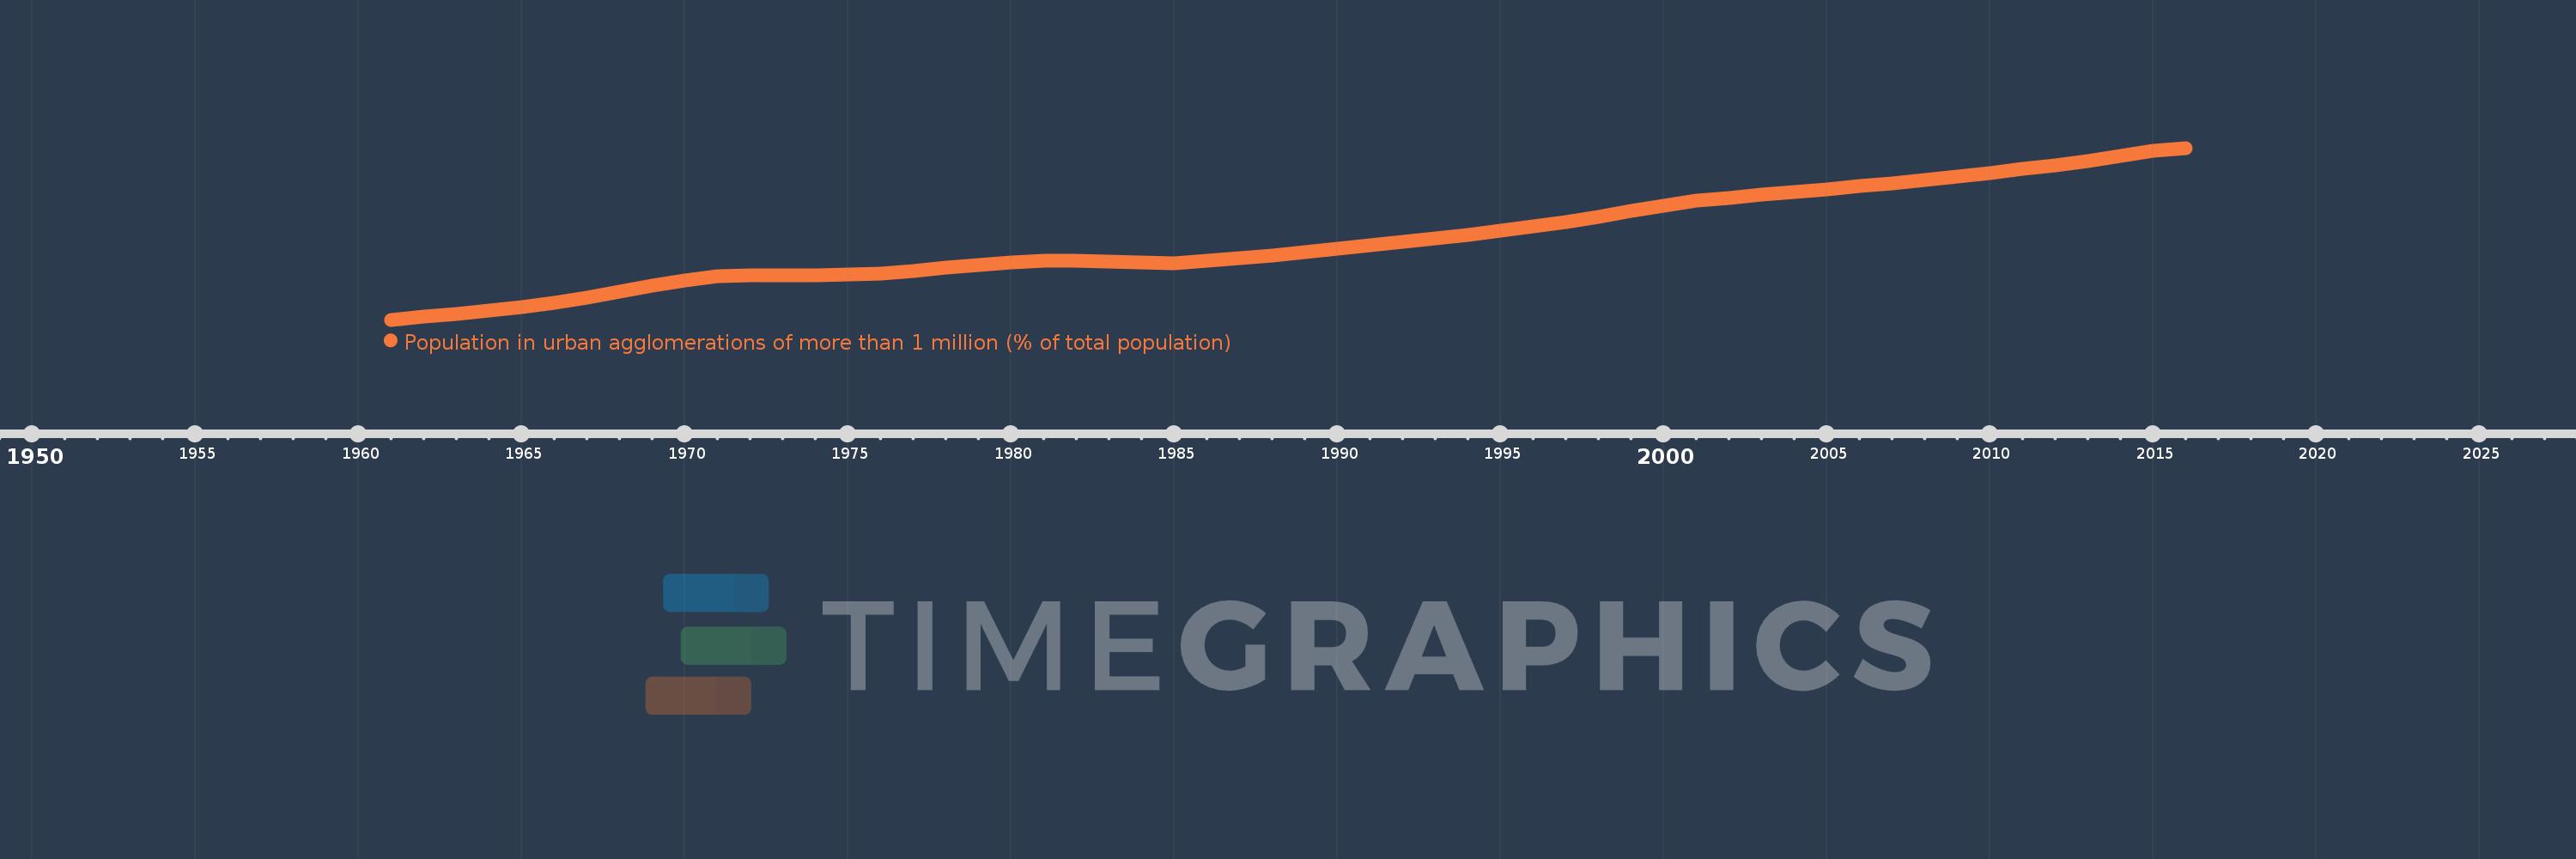
Population in urban agglomerations of more than 1 million (% of total population)
2016,2015,2014,2013,2012,2011,2010,2009,2008,2007,2006,2005,2004,2003,2002,2001,2000,1999,1998,1997,1996,1995,1994,1993,1992,1991,1990,1989,1988,1987,1986,1985,1984,1983,1982,1981,1980,1979,1978,1977,1976,1975,1974,1973,1972,1971,1970,1969,1968,1967,1966,1965,1964,1963,1962,1961
This statistics in other country:
Timeline:
This timeline shows a graph from 1961 to 2016 of Ghana. No data until 1960. Number of actual observations by date: 56.
Source name:
World Development Indicators
Source organization:
United Nations, World Urbanization Prospects.
Categories, topics:
Climate Change, Urban Development
Last updated:
apr 23, 2017
Indicators value changes by year
At the date of observation
Value
Absolute change
Change from previous value
jan 1, 1961
9.224
+9.224
0.0%
jan 1, 1962
9.37
+0.146
1.58%
jan 1, 1963
9.521
+0.152
1.62%
jan 1, 1964
9.686
+0.164
1.73%
jan 1, 1965
9.873
+0.187
1.93%
jan 1, 1966
10.087
+0.214
2.17%
jan 1, 1967
10.335
+0.248
2.46%
jan 1, 1968
10.613
+0.278
2.69%
jan 1, 1969
10.908
+0.295
2.78%
jan 1, 1970
11.197
+0.289
2.65%
jan 1, 1971
11.399
+0.202
1.81%
jan 1, 1972
11.433
+0.033
0.29%
jan 1, 1973
11.441
+0.009
0.08%
jan 1, 1974
11.446
+0.005
0.04%
jan 1, 1975
11.475
+0.029
0.26%
jan 1, 1976
11.545
+0.069
0.6%
jan 1, 1977
11.662
+0.117
1.01%
jan 1, 1978
11.813
+0.151
1.3%
jan 1, 1979
11.972
+0.159
1.35%
jan 1, 1980
12.1
+0.128
1.07%
jan 1, 1981
12.172
+0.072
0.59%
jan 1, 1982
12.179
+0.007
0.06%
jan 1, 1983
12.138
-0.041
-0.33%
jan 1, 1984
12.073
-0.065
-0.54%
jan 1, 1985
12.054
-0.019
-0.16%
jan 1, 1986
12.15
+0.096
0.79%
jan 1, 1987
12.277
+0.127
1.04%
jan 1, 1988
12.427
+0.151
1.23%
jan 1, 1989
12.595
+0.168
1.35%
jan 1, 1990
12.767
+0.172
1.37%
jan 1, 1991
12.939
+0.172
1.34%
jan 1, 1992
13.107
+0.168
1.3%
jan 1, 1993
13.278
+0.17
1.3%
jan 1, 1994
13.455
+0.177
1.33%
jan 1, 1995
13.649
+0.195
1.45%
jan 1, 1996
13.866
+0.217
1.59%
jan 1, 1997
14.109
+0.243
1.75%
jan 1, 1998
14.37
+0.262
1.86%
jan 1, 1999
14.646
+0.276
1.92%
jan 1, 2000
14.924
+0.278
1.9%
jan 1, 2001
15.166
+0.242
1.62%
jan 1, 2002
15.314
+0.148
0.98%
jan 1, 2003
15.457
+0.143
0.93%
jan 1, 2004
15.597
+0.14
0.91%
jan 1, 2005
15.74
+0.143
0.92%
jan 1, 2006
15.887
+0.147
0.93%
jan 1, 2007
16.04
+0.154
0.97%
jan 1, 2008
16.2
+0.16
1.0%
jan 1, 2009
16.369
+0.169
1.04%
jan 1, 2010
16.546
+0.177
1.08%
jan 1, 2011
16.736
+0.19
1.15%
jan 1, 2012
16.938
+0.202
1.21%
jan 1, 2013
17.155
+0.217
1.28%
jan 1, 2014
17.386
+0.231
1.35%
jan 1, 2015
17.633
+0.247
1.42%
jan 1, 2016
17.79
+0.156
0.89%
Ranking of countries by current statistics by years


Comments: