29
/
en
AIzaSyAYiBZKx7MnpbEhh9jyipgxe19OcubqV5w
April 1, 2024
35300
Heavily indebted poor countries (HIPC)
HPC
false
2
1
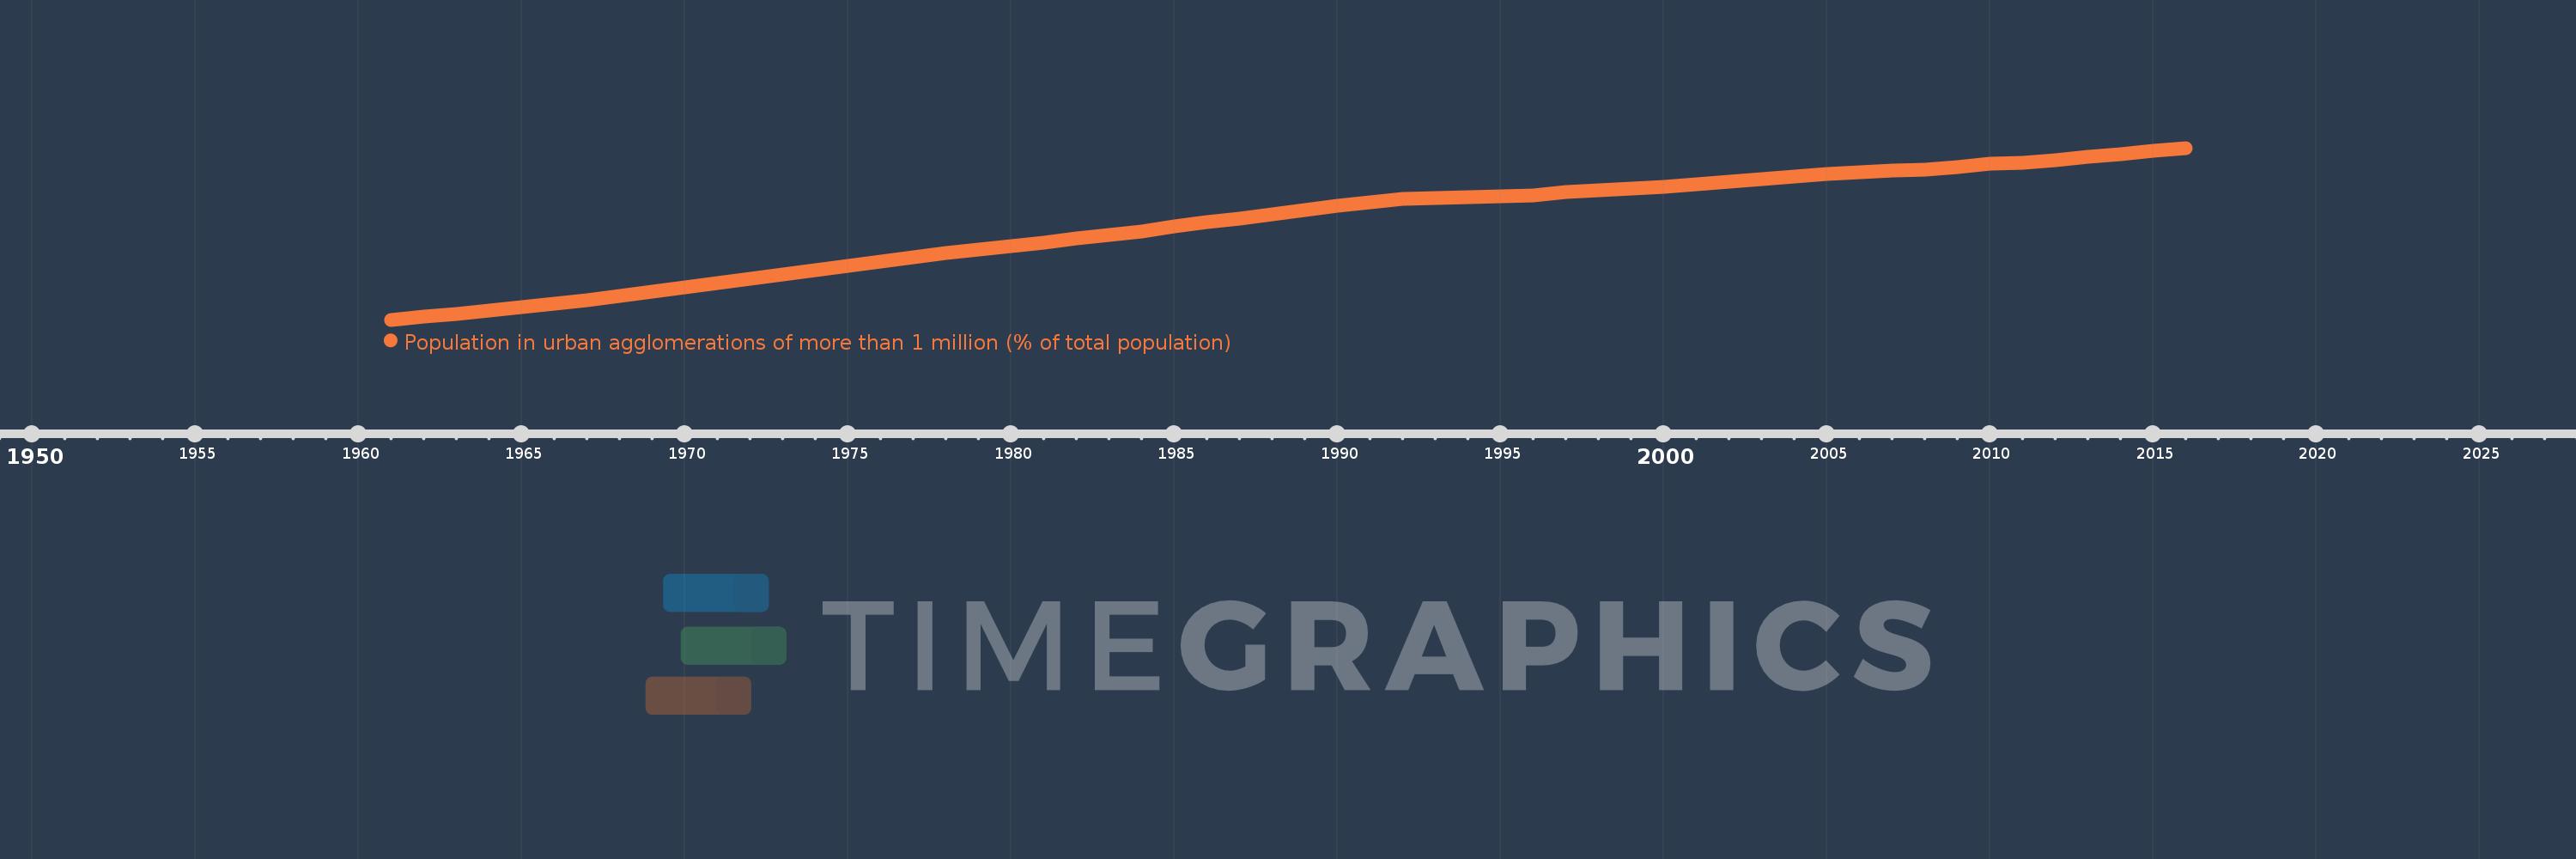
Population in urban agglomerations of more than 1 million (% of total population)
2016,2015,2014,2013,2012,2011,2010,2009,2008,2007,2006,2005,2004,2003,2002,2001,2000,1999,1998,1997,1996,1995,1994,1993,1992,1991,1990,1989,1988,1987,1986,1985,1984,1983,1982,1981,1980,1979,1978,1977,1976,1975,1974,1973,1972,1971,1970,1969,1968,1967,1966,1965,1964,1963,1962,1961
This statistics in other country:
Timeline:
This timeline shows a graph from 1961 to 2016 of Heavily indebted poor countries (HIPC). No data until 1960. Number of actual observations by date: 56.
Source name:
World Development Indicators
Source organization:
United Nations, World Urbanization Prospects.
Categories, topics:
Climate Change, Urban Development
Last updated:
apr 23, 2017
Indicators value changes by year
At the date of observation
Value
Absolute change
Change from previous value
jan 1, 1961
4.322
+4.322
0.0%
jan 1, 1962
4.486
+0.164
3.79%
jan 1, 1963
4.652
+0.166
3.7%
jan 1, 1964
4.816
+0.165
3.54%
jan 1, 1965
4.999
+0.183
3.79%
jan 1, 1966
5.197
+0.198
3.96%
jan 1, 1967
5.406
+0.209
4.03%
jan 1, 1968
5.629
+0.222
4.12%
jan 1, 1969
5.863
+0.234
4.16%
jan 1, 1970
6.108
+0.245
4.17%
jan 1, 1971
6.342
+0.235
3.85%
jan 1, 1972
6.565
+0.222
3.5%
jan 1, 1973
6.796
+0.231
3.52%
jan 1, 1974
7.028
+0.233
3.42%
jan 1, 1975
7.26
+0.231
3.29%
jan 1, 1976
7.495
+0.235
3.24%
jan 1, 1977
7.723
+0.228
3.04%
jan 1, 1978
7.946
+0.223
2.88%
jan 1, 1979
8.174
+0.227
2.86%
jan 1, 1980
8.366
+0.192
2.35%
jan 1, 1981
8.554
+0.188
2.25%
jan 1, 1982
8.744
+0.19
2.23%
jan 1, 1983
8.942
+0.198
2.26%
jan 1, 1984
9.162
+0.22
2.46%
jan 1, 1985
9.402
+0.24
2.62%
jan 1, 1986
9.637
+0.235
2.5%
jan 1, 1987
9.869
+0.232
2.41%
jan 1, 1988
10.098
+0.229
2.32%
jan 1, 1989
10.324
+0.225
2.23%
jan 1, 1990
10.532
+0.208
2.02%
jan 1, 1991
10.734
+0.202
1.92%
jan 1, 1992
10.927
+0.193
1.8%
jan 1, 1993
10.968
+0.041
0.38%
jan 1, 1994
11.018
+0.05
0.45%
jan 1, 1995
11.054
+0.036
0.32%
jan 1, 1996
11.108
+0.055
0.49%
jan 1, 1997
11.3
+0.192
1.73%
jan 1, 1998
11.399
+0.099
0.87%
jan 1, 1999
11.501
+0.102
0.9%
jan 1, 2000
11.6
+0.098
0.86%
jan 1, 2001
11.733
+0.133
1.15%
jan 1, 2002
11.864
+0.131
1.11%
jan 1, 2003
12.003
+0.14
1.18%
jan 1, 2004
12.14
+0.136
1.14%
jan 1, 2005
12.28
+0.141
1.16%
jan 1, 2006
12.376
+0.096
0.78%
jan 1, 2007
12.488
+0.112
0.91%
jan 1, 2008
12.525
+0.037
0.3%
jan 1, 2009
12.667
+0.142
1.14%
jan 1, 2010
12.83
+0.163
1.29%
jan 1, 2011
12.886
+0.056
0.43%
jan 1, 2012
13.046
+0.161
1.25%
jan 1, 2013
13.213
+0.166
1.27%
jan 1, 2014
13.385
+0.172
1.3%
jan 1, 2015
13.567
+0.182
1.36%
jan 1, 2016
13.71
+0.144
1.06%
Ranking of countries by current statistics by years


Comments: