29
/
en
AIzaSyAYiBZKx7MnpbEhh9jyipgxe19OcubqV5w
April 1, 2024
212187
Niger
NER
true
2
1
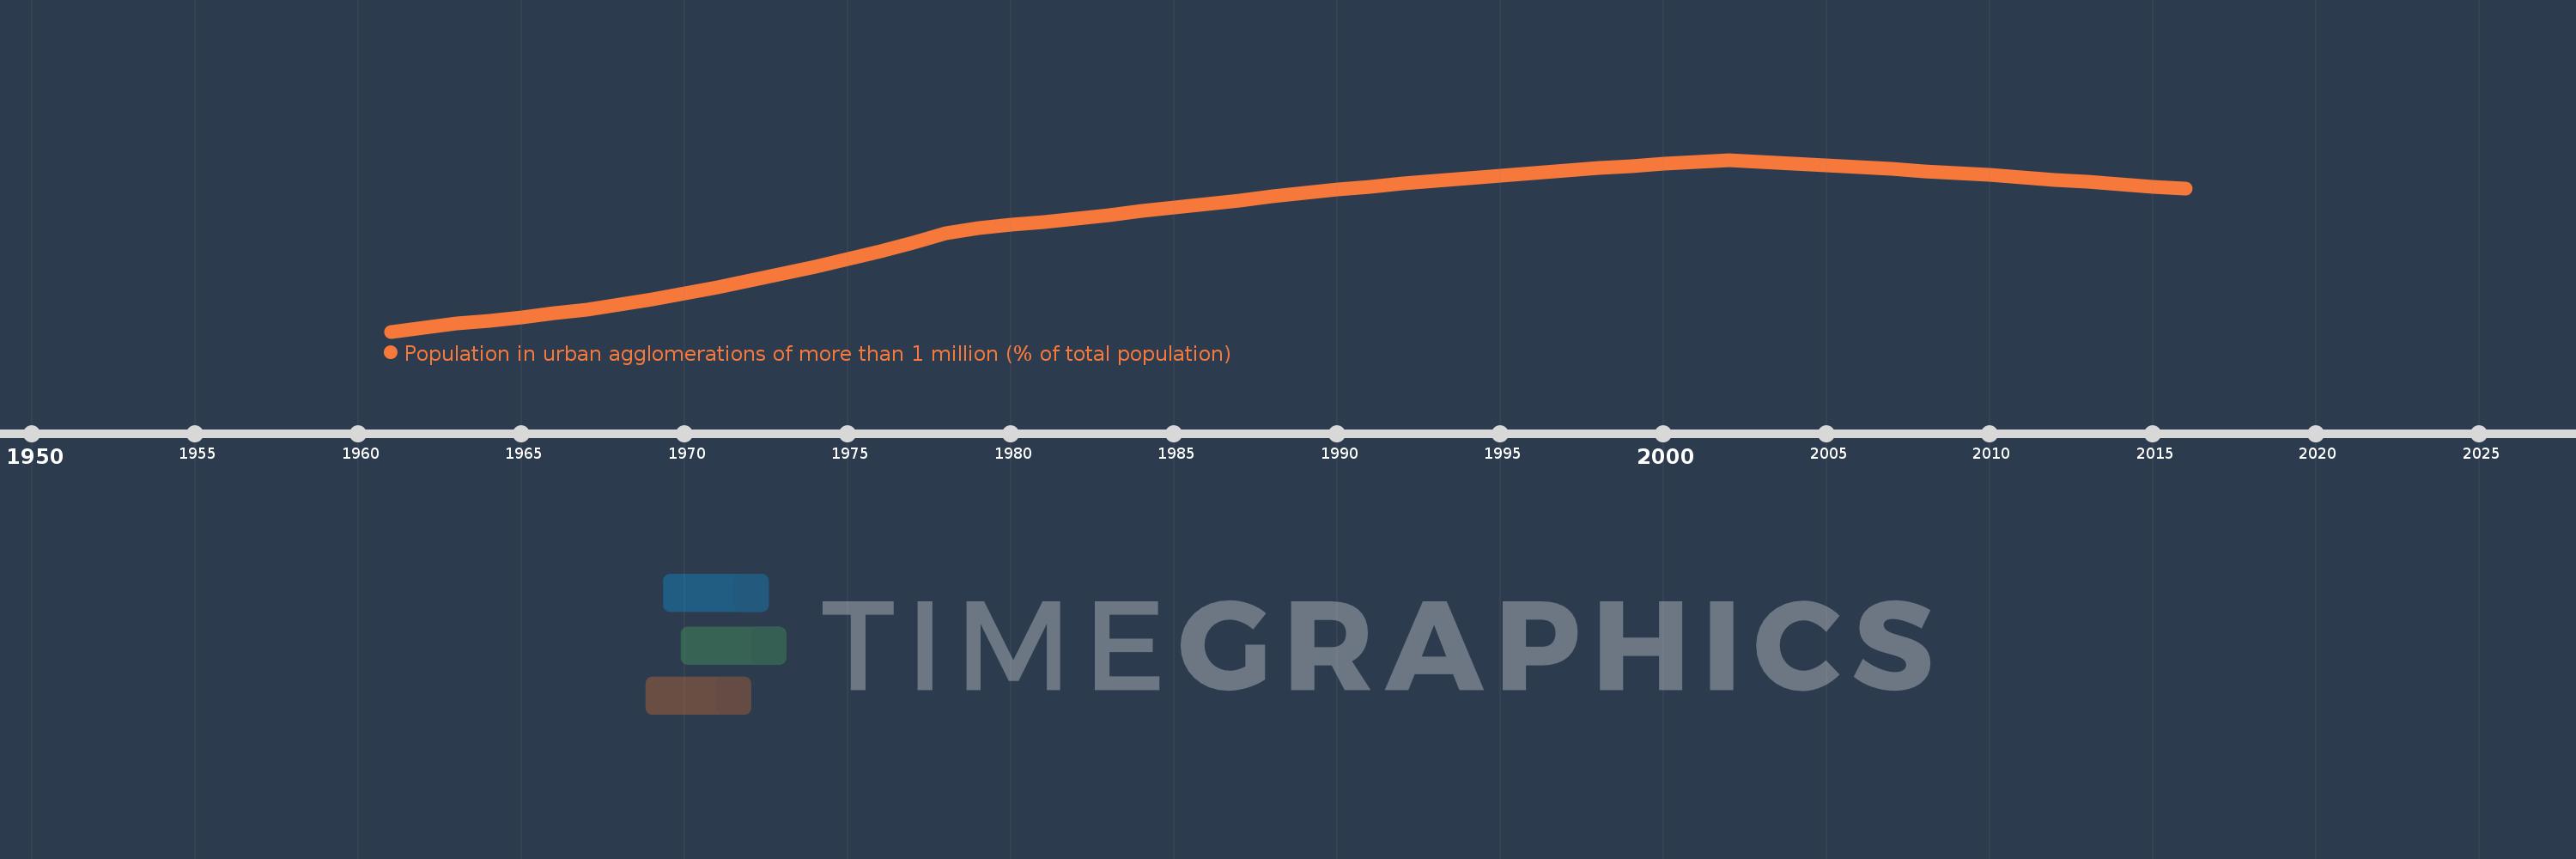
Population in urban agglomerations of more than 1 million (% of total population)
2016,2015,2014,2013,2012,2011,2010,2009,2008,2007,2006,2005,2004,2003,2002,2001,2000,1999,1998,1997,1996,1995,1994,1993,1992,1991,1990,1989,1988,1987,1986,1985,1984,1983,1982,1981,1980,1979,1978,1977,1976,1975,1974,1973,1972,1971,1970,1969,1968,1967,1966,1965,1964,1963,1962,1961
This statistics in other country:
Timeline:
This timeline shows a graph from 1961 to 2016 of Niger. No data until 1960. Number of actual observations by date: 56.
Source name:
World Development Indicators
Source organization:
United Nations, World Urbanization Prospects.
Categories, topics:
Climate Change, Urban Development
Last updated:
apr 23, 2017
Indicators value changes by year
At the date of observation
Value
Absolute change
Change from previous value
jan 1, 1961
1.695
+1.695
0.0%
jan 1, 1962
1.795
+0.1
5.89%
jan 1, 1963
1.9
+0.105
5.85%
jan 1, 1964
1.986
+0.087
4.56%
jan 1, 1965
2.078
+0.091
4.6%
jan 1, 1966
2.174
+0.096
4.64%
jan 1, 1967
2.277
+0.102
4.71%
jan 1, 1968
2.413
+0.136
5.98%
jan 1, 1969
2.558
+0.145
6.01%
jan 1, 1970
2.711
+0.153
5.99%
jan 1, 1971
2.873
+0.162
5.98%
jan 1, 1972
3.044
+0.171
5.96%
jan 1, 1973
3.226
+0.181
5.96%
jan 1, 1974
3.416
+0.191
5.91%
jan 1, 1975
3.618
+0.202
5.9%
jan 1, 1976
3.831
+0.213
5.88%
jan 1, 1977
4.056
+0.225
5.87%
jan 1, 1978
4.292
+0.236
5.82%
jan 1, 1979
4.436
+0.145
3.37%
jan 1, 1980
4.519
+0.083
1.86%
jan 1, 1981
4.605
+0.086
1.91%
jan 1, 1982
4.695
+0.09
1.94%
jan 1, 1983
4.788
+0.093
1.98%
jan 1, 1984
4.883
+0.095
1.99%
jan 1, 1985
4.98
+0.097
1.98%
jan 1, 1986
5.076
+0.097
1.94%
jan 1, 1987
5.174
+0.097
1.92%
jan 1, 1988
5.271
+0.097
1.88%
jan 1, 1989
5.366
+0.095
1.81%
jan 1, 1990
5.455
+0.089
1.65%
jan 1, 1991
5.539
+0.084
1.55%
jan 1, 1992
5.619
+0.08
1.44%
jan 1, 1993
5.695
+0.076
1.35%
jan 1, 1994
5.766
+0.071
1.25%
jan 1, 1995
5.834
+0.068
1.18%
jan 1, 1996
5.899
+0.065
1.12%
jan 1, 1997
5.962
+0.063
1.07%
jan 1, 1998
6.022
+0.06
1.01%
jan 1, 1999
6.082
+0.059
0.98%
jan 1, 2000
6.141
+0.059
0.97%
jan 1, 2001
6.201
+0.06
0.98%
jan 1, 2002
6.248
+0.048
0.77%
jan 1, 2003
6.2
-0.048
-0.78%
jan 1, 2004
6.151
-0.049
-0.78%
jan 1, 2005
6.103
-0.049
-0.79%
jan 1, 2006
6.053
-0.05
-0.82%
jan 1, 2007
6.002
-0.05
-0.83%
jan 1, 2008
5.951
-0.051
-0.85%
jan 1, 2009
5.899
-0.052
-0.88%
jan 1, 2010
5.844
-0.055
-0.94%
jan 1, 2011
5.785
-0.058
-0.99%
jan 1, 2012
5.724
-0.061
-1.05%
jan 1, 2013
5.662
-0.063
-1.1%
jan 1, 2014
5.597
-0.064
-1.14%
jan 1, 2015
5.533
-0.064
-1.15%
jan 1, 2016
5.476
-0.057
-1.04%
Ranking of countries by current statistics by years


Comments: