29
/
en
AIzaSyAYiBZKx7MnpbEhh9jyipgxe19OcubqV5w
April 1, 2024
58453
South Asia (IDA & IBRD)
TSA
false
2
1
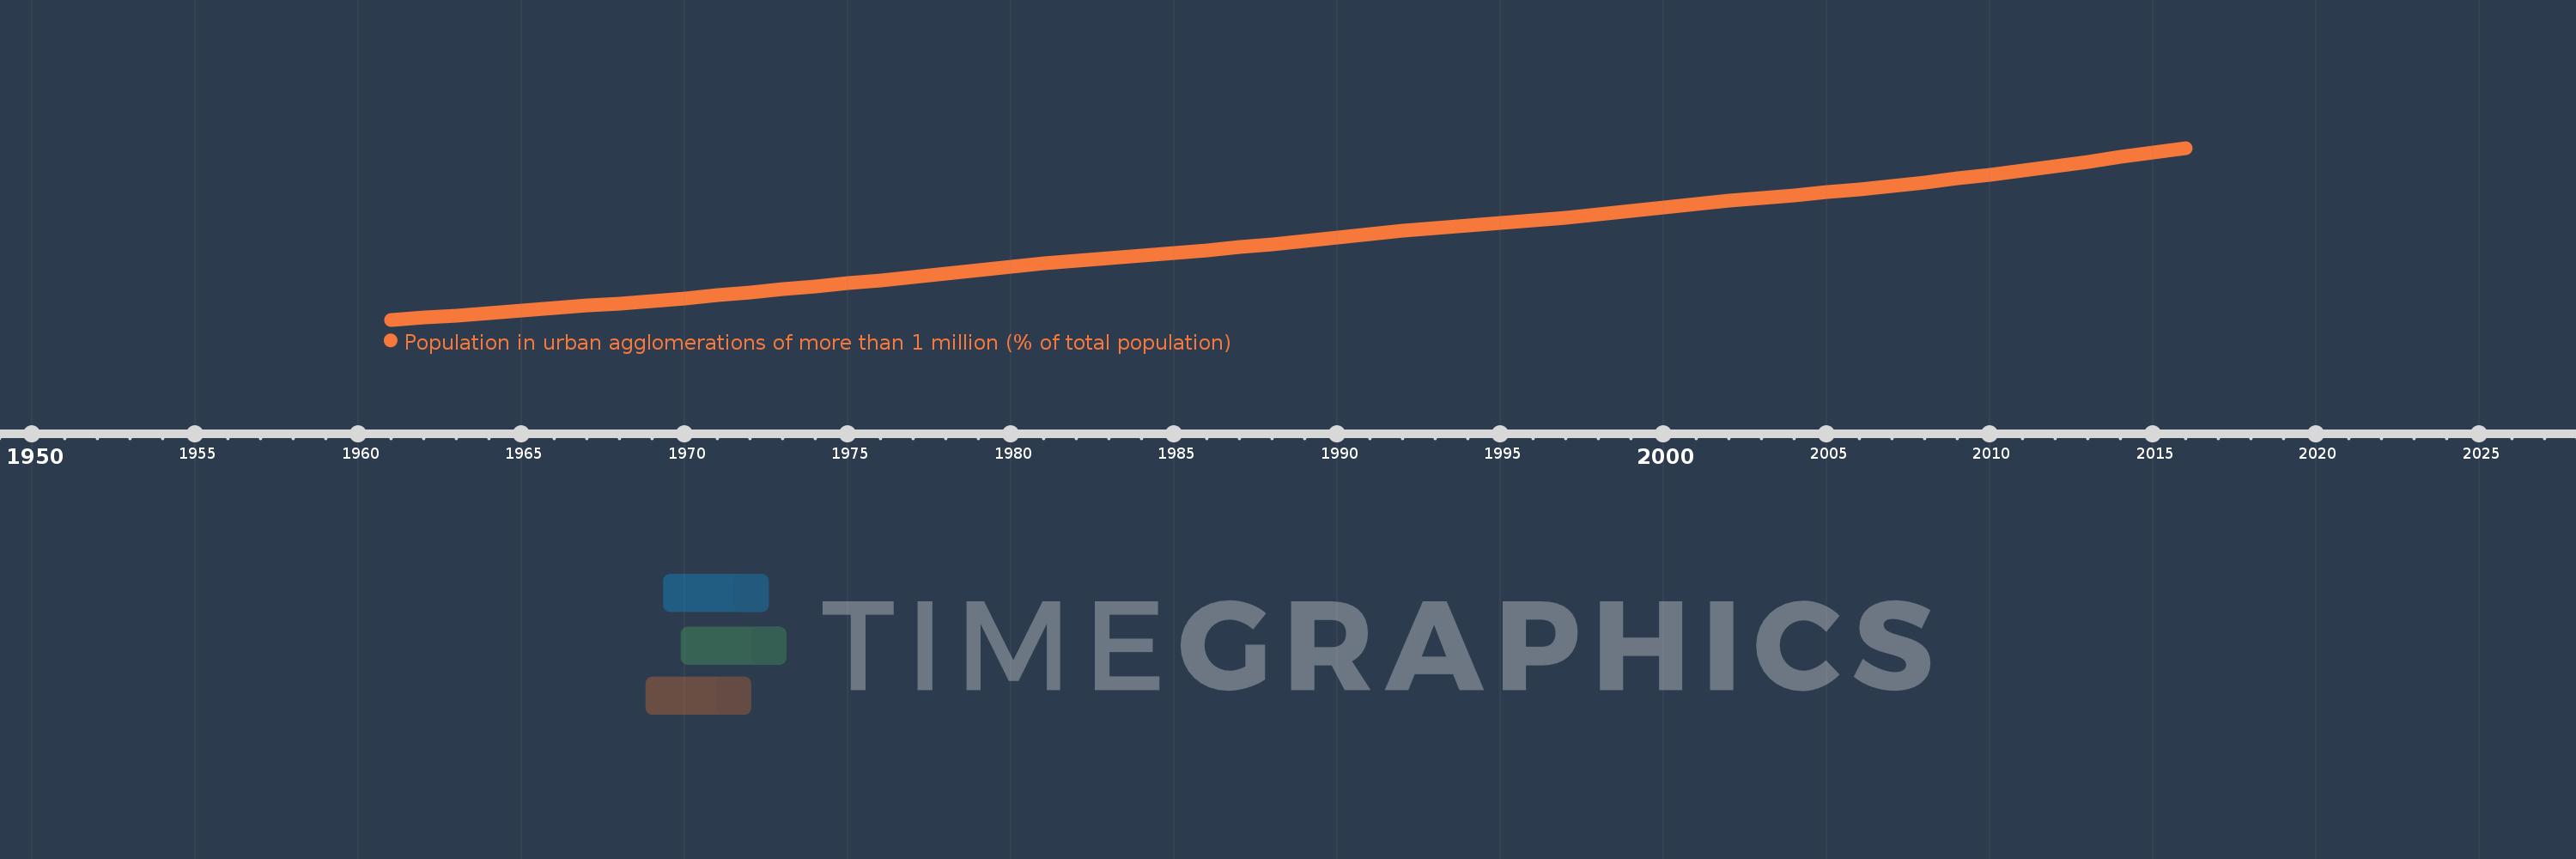
Population in urban agglomerations of more than 1 million (% of total population)
2016,2015,2014,2013,2012,2011,2010,2009,2008,2007,2006,2005,2004,2003,2002,2001,2000,1999,1998,1997,1996,1995,1994,1993,1992,1991,1990,1989,1988,1987,1986,1985,1984,1983,1982,1981,1980,1979,1978,1977,1976,1975,1974,1973,1972,1971,1970,1969,1968,1967,1966,1965,1964,1963,1962,1961
This statistics in other country:
Timeline:
This timeline shows a graph from 1961 to 2016 of South Asia (IDA & IBRD). No data until 1960. Number of actual observations by date: 56.
Source name:
World Development Indicators
Source organization:
United Nations, World Urbanization Prospects.
Categories, topics:
Climate Change, Urban Development
Last updated:
apr 23, 2017
Indicators value changes by year
Maximum:
15.253
jan 1, 2016
At the date of observation
Value
Absolute change
Change from previous value
jan 1, 1961
6.87
+6.87
0.0%
jan 1, 1962
6.972
+0.102
1.49%
jan 1, 1963
7.085
+0.113
1.62%
jan 1, 1964
7.199
+0.114
1.61%
jan 1, 1965
7.315
+0.116
1.61%
jan 1, 1966
7.432
+0.117
1.6%
jan 1, 1967
7.551
+0.119
1.6%
jan 1, 1968
7.672
+0.121
1.61%
jan 1, 1969
7.797
+0.124
1.62%
jan 1, 1970
7.923
+0.127
1.62%
jan 1, 1971
8.054
+0.131
1.65%
jan 1, 1972
8.192
+0.138
1.72%
jan 1, 1973
8.347
+0.154
1.89%
jan 1, 1974
8.502
+0.155
1.86%
jan 1, 1975
8.656
+0.155
1.82%
jan 1, 1976
8.806
+0.15
1.73%
jan 1, 1977
8.96
+0.153
1.74%
jan 1, 1978
9.115
+0.156
1.74%
jan 1, 1979
9.275
+0.16
1.75%
jan 1, 1980
9.44
+0.164
1.77%
jan 1, 1981
9.606
+0.167
1.77%
jan 1, 1982
9.758
+0.152
1.58%
jan 1, 1983
9.877
+0.119
1.21%
jan 1, 1984
10.0
+0.123
1.25%
jan 1, 1985
10.13
+0.13
1.3%
jan 1, 1986
10.264
+0.135
1.33%
jan 1, 1987
10.406
+0.142
1.38%
jan 1, 1988
10.555
+0.149
1.43%
jan 1, 1989
10.711
+0.157
1.48%
jan 1, 1990
10.875
+0.164
1.53%
jan 1, 1991
11.048
+0.173
1.59%
jan 1, 1992
11.208
+0.161
1.45%
jan 1, 1993
11.326
+0.118
1.05%
jan 1, 1994
11.45
+0.123
1.09%
jan 1, 1995
11.58
+0.13
1.14%
jan 1, 1996
11.718
+0.138
1.19%
jan 1, 1997
11.864
+0.146
1.24%
jan 1, 1998
12.016
+0.153
1.29%
jan 1, 1999
12.177
+0.161
1.34%
jan 1, 2000
12.347
+0.17
1.39%
jan 1, 2001
12.526
+0.179
1.45%
jan 1, 2002
12.688
+0.162
1.29%
jan 1, 2003
12.813
+0.125
0.98%
jan 1, 2004
12.946
+0.133
1.04%
jan 1, 2005
13.09
+0.143
1.11%
jan 1, 2006
13.242
+0.153
1.17%
jan 1, 2007
13.406
+0.164
1.24%
jan 1, 2008
13.58
+0.174
1.3%
jan 1, 2009
13.764
+0.184
1.36%
jan 1, 2010
13.956
+0.192
1.4%
jan 1, 2011
14.157
+0.201
1.44%
jan 1, 2012
14.366
+0.209
1.48%
jan 1, 2013
14.583
+0.218
1.51%
jan 1, 2014
14.81
+0.226
1.55%
jan 1, 2015
15.045
+0.235
1.59%
jan 1, 2016
15.253
+0.208
1.38%
Ranking of countries by current statistics by years


Comments: