29
/
en
AIzaSyAYiBZKx7MnpbEhh9jyipgxe19OcubqV5w
April 1, 2024
43793
Latin America & the Caribbean (IDA & IBRD countries)
TLA
false
2
1
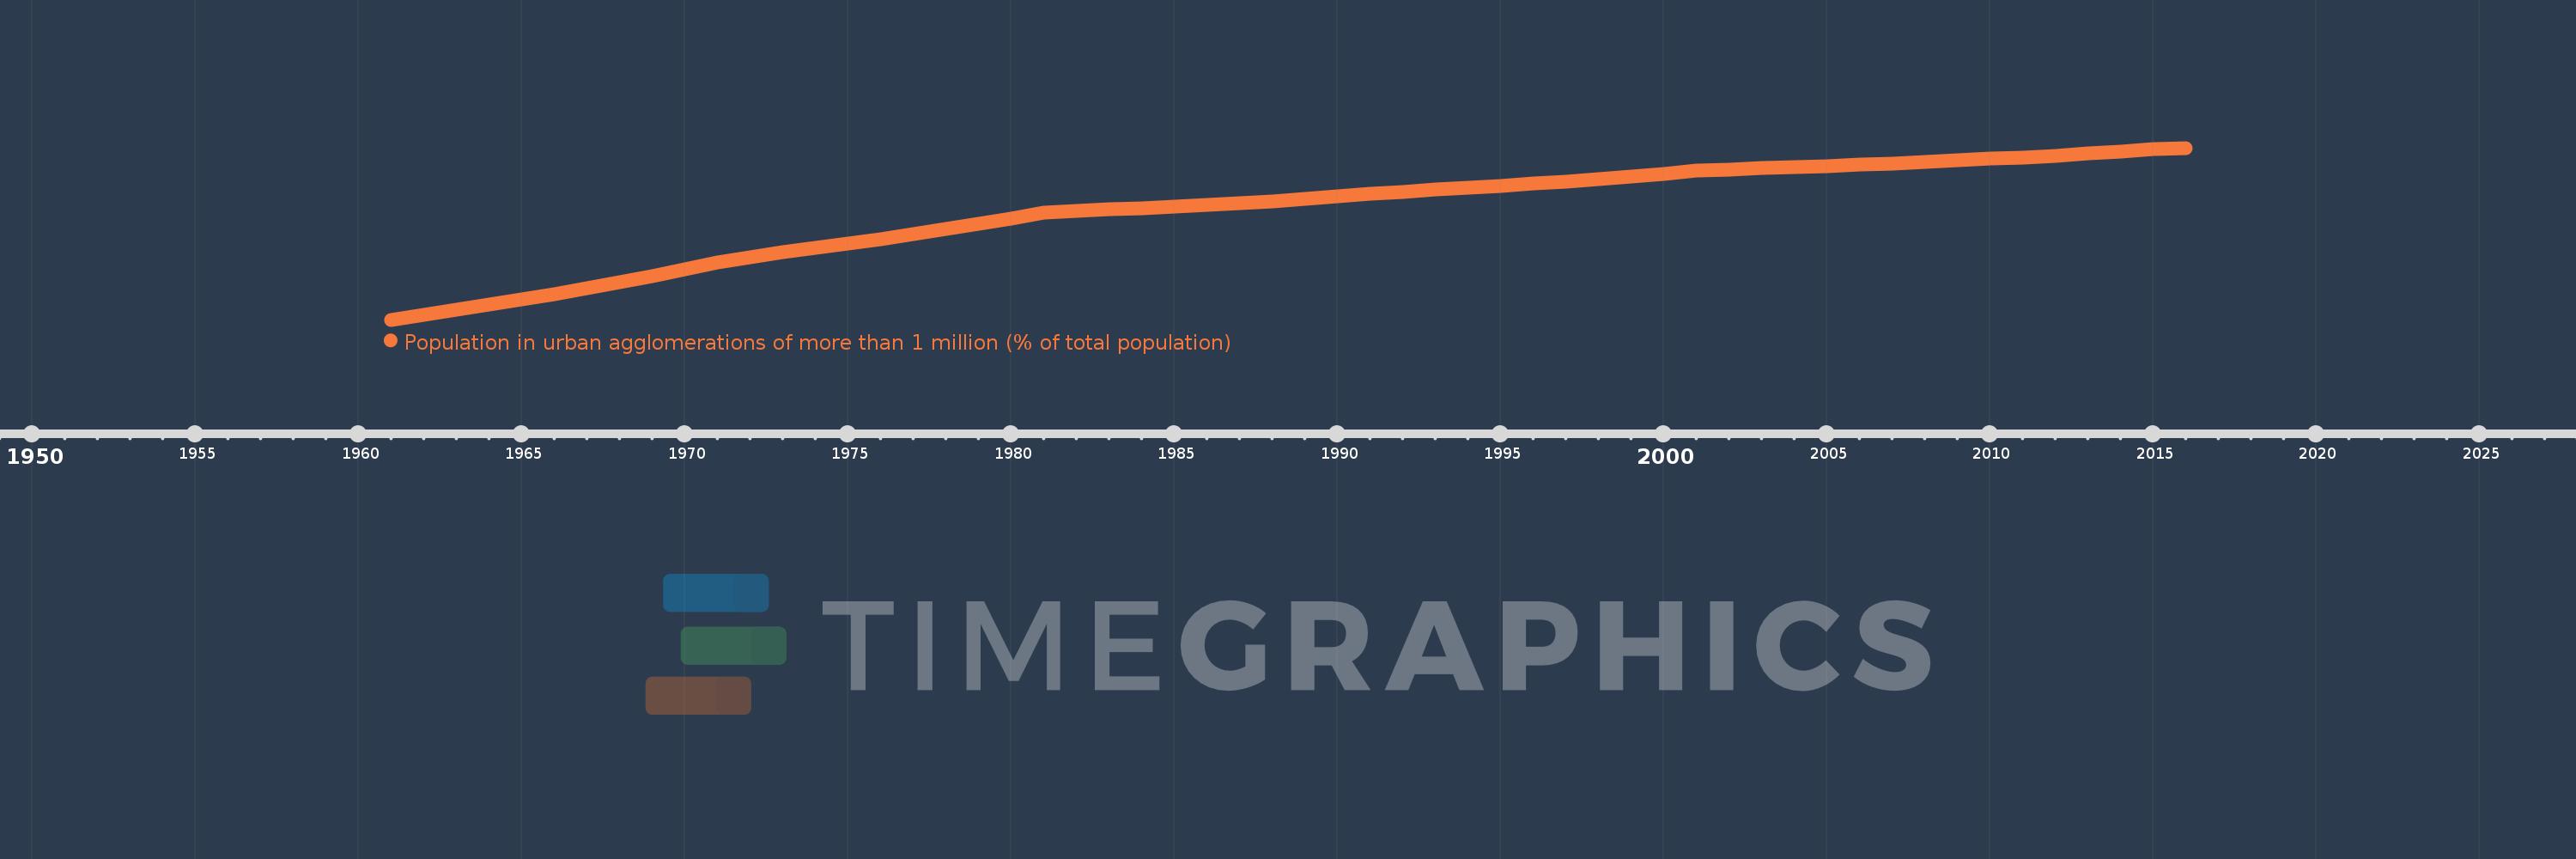
Population in urban agglomerations of more than 1 million (% of total population)
2016,2015,2014,2013,2012,2011,2010,2009,2008,2007,2006,2005,2004,2003,2002,2001,2000,1999,1998,1997,1996,1995,1994,1993,1992,1991,1990,1989,1988,1987,1986,1985,1984,1983,1982,1981,1980,1979,1978,1977,1976,1975,1974,1973,1972,1971,1970,1969,1968,1967,1966,1965,1964,1963,1962,1961
This statistics in other country:
Timeline:
This timeline shows a graph from 1961 to 2016 of Latin America & the Caribbean (IDA & IBRD countries). No data until 1960. Number of actual observations by date: 56.
Source name:
World Development Indicators
Source organization:
United Nations, World Urbanization Prospects.
Categories, topics:
Climate Change, Urban Development
Last updated:
apr 23, 2017
Indicators value changes by year
Maximum:
36.721
jan 1, 2016
At the date of observation
Value
Absolute change
Change from previous value
jan 1, 1961
23.2
+23.2
0.0%
jan 1, 1962
23.593
+0.393
1.69%
jan 1, 1963
23.982
+0.389
1.65%
jan 1, 1964
24.384
+0.402
1.67%
jan 1, 1965
24.806
+0.423
1.73%
jan 1, 1966
25.224
+0.418
1.69%
jan 1, 1967
25.67
+0.446
1.77%
jan 1, 1968
26.144
+0.473
1.84%
jan 1, 1969
26.645
+0.501
1.92%
jan 1, 1970
27.168
+0.523
1.96%
jan 1, 1971
27.699
+0.531
1.95%
jan 1, 1972
28.11
+0.411
1.48%
jan 1, 1973
28.492
+0.381
1.36%
jan 1, 1974
28.859
+0.368
1.29%
jan 1, 1975
29.205
+0.346
1.2%
jan 1, 1976
29.554
+0.349
1.19%
jan 1, 1977
29.926
+0.372
1.26%
jan 1, 1978
30.316
+0.391
1.31%
jan 1, 1979
30.731
+0.414
1.37%
jan 1, 1980
31.167
+0.436
1.42%
jan 1, 1981
31.621
+0.454
1.46%
jan 1, 1982
31.789
+0.168
0.53%
jan 1, 1983
31.893
+0.104
0.33%
jan 1, 1984
31.986
+0.092
0.29%
jan 1, 1985
32.095
+0.109
0.34%
jan 1, 1986
32.221
+0.127
0.4%
jan 1, 1987
32.365
+0.144
0.45%
jan 1, 1988
32.528
+0.163
0.5%
jan 1, 1989
32.713
+0.184
0.57%
jan 1, 1990
32.913
+0.201
0.61%
jan 1, 1991
33.115
+0.202
0.61%
jan 1, 1992
33.281
+0.166
0.5%
jan 1, 1993
33.425
+0.144
0.43%
jan 1, 1994
33.568
+0.143
0.43%
jan 1, 1995
33.723
+0.155
0.46%
jan 1, 1996
33.897
+0.174
0.52%
jan 1, 1997
34.077
+0.181
0.53%
jan 1, 1998
34.264
+0.186
0.55%
jan 1, 1999
34.467
+0.204
0.59%
jan 1, 2000
34.69
+0.223
0.65%
jan 1, 2001
34.919
+0.228
0.66%
jan 1, 2002
35.024
+0.105
0.3%
jan 1, 2003
35.119
+0.095
0.27%
jan 1, 2004
35.203
+0.084
0.24%
jan 1, 2005
35.297
+0.094
0.27%
jan 1, 2006
35.402
+0.104
0.29%
jan 1, 2007
35.511
+0.109
0.31%
jan 1, 2008
35.63
+0.119
0.34%
jan 1, 2009
35.761
+0.131
0.37%
jan 1, 2010
35.901
+0.141
0.39%
jan 1, 2011
35.944
+0.042
0.12%
jan 1, 2012
36.097
+0.153
0.43%
jan 1, 2013
36.262
+0.165
0.46%
jan 1, 2014
36.439
+0.177
0.49%
jan 1, 2015
36.629
+0.19
0.52%
jan 1, 2016
36.721
+0.093
0.25%
Ranking of countries by current statistics by years


Comments: