29
/
en
AIzaSyAYiBZKx7MnpbEhh9jyipgxe19OcubqV5w
April 1, 2024
166658
Kazakhstan
KAZ
true
2
1
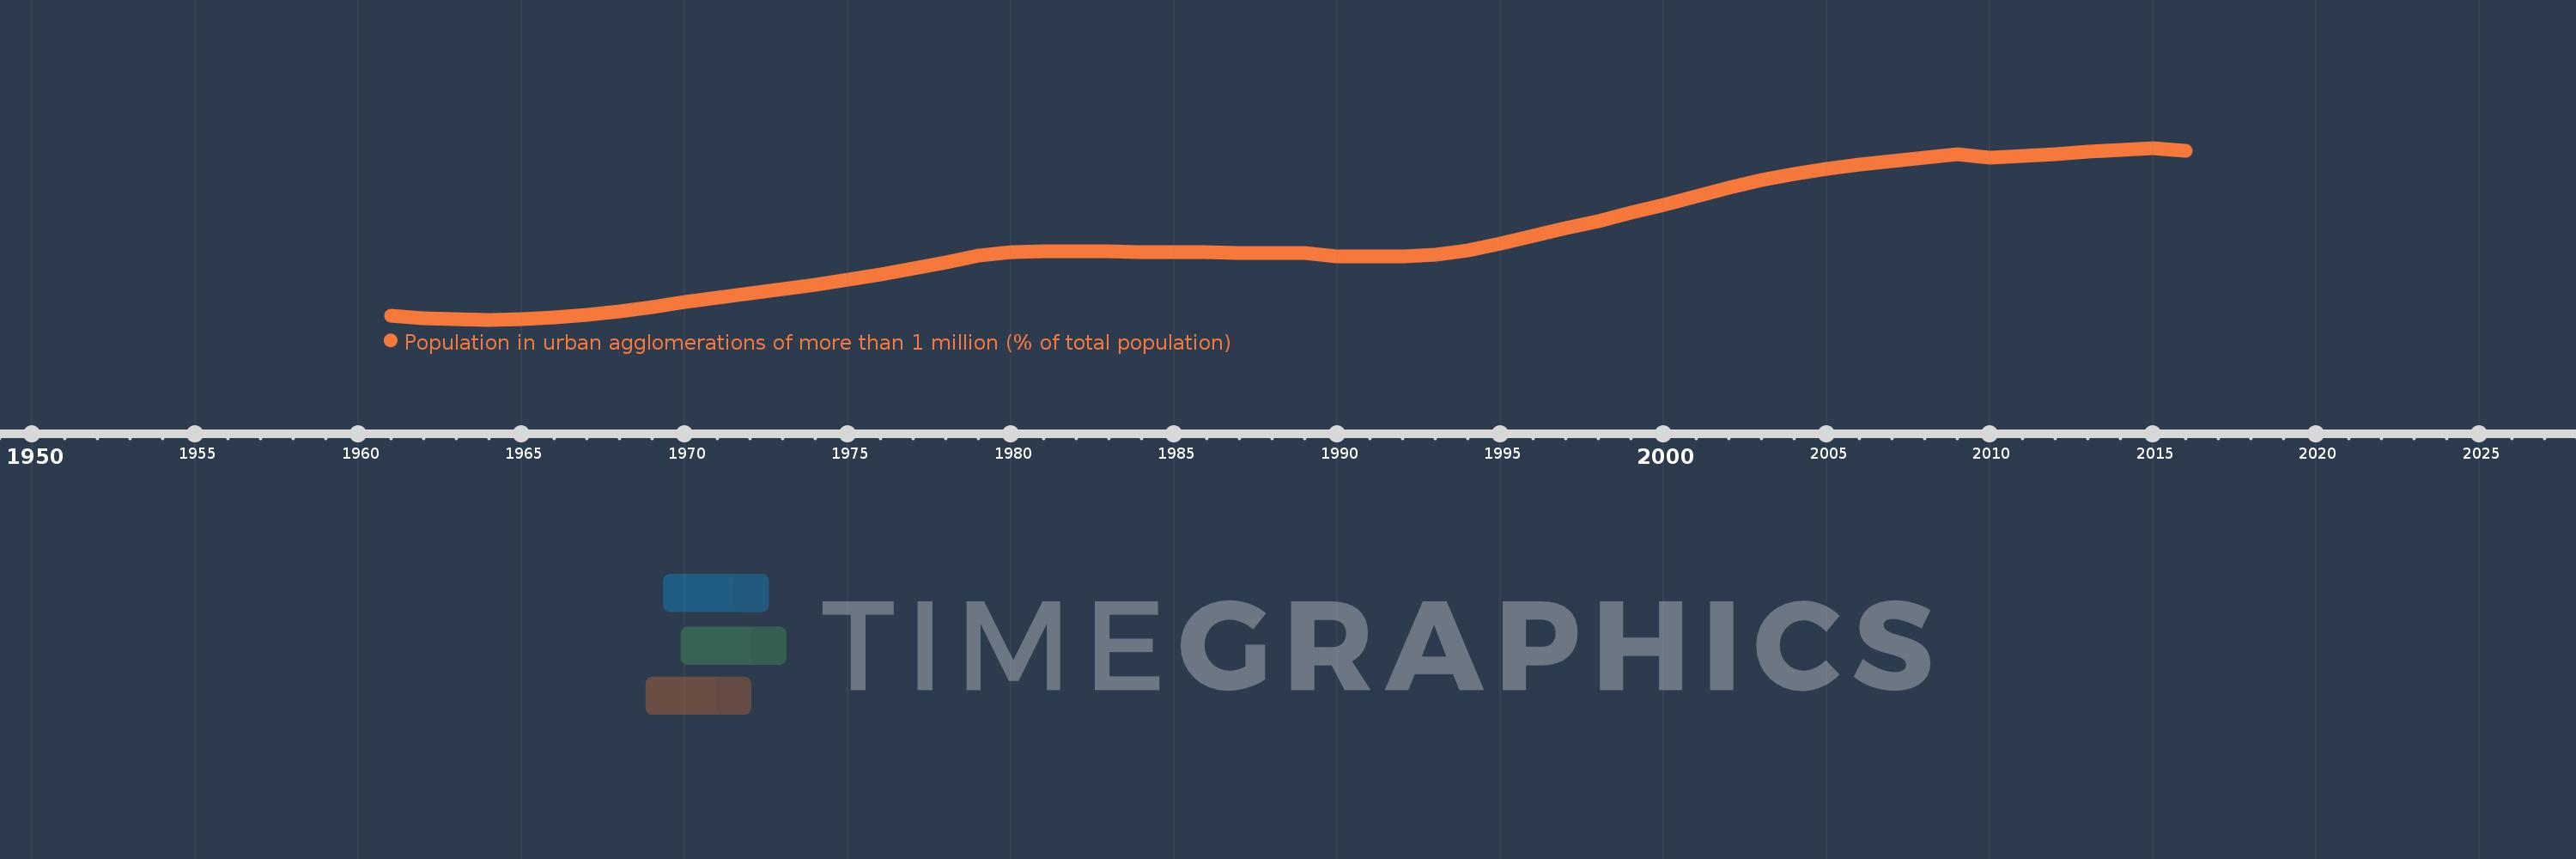
Population in urban agglomerations of more than 1 million (% of total population)
2016,2015,2014,2013,2012,2011,2010,2009,2008,2007,2006,2005,2004,2003,2002,2001,2000,1999,1998,1997,1996,1995,1994,1993,1992,1991,1990,1989,1988,1987,1986,1985,1984,1983,1982,1981,1980,1979,1978,1977,1976,1975,1974,1973,1972,1971,1970,1969,1968,1967,1966,1965,1964,1963,1962,1961
This statistics in other country:
Timeline:
This timeline shows a graph from 1961 to 2016 of Kazakhstan. No data until 1960. Number of actual observations by date: 56.
Source name:
World Development Indicators
Source organization:
United Nations, World Urbanization Prospects.
Categories, topics:
Climate Change, Urban Development
Last updated:
apr 23, 2017
Indicators value changes by year
At the date of observation
Value
Absolute change
Change from previous value
jan 1, 1961
5.442
+5.442
0.0%
jan 1, 1962
5.398
-0.044
-0.81%
jan 1, 1963
5.371
-0.028
-0.51%
jan 1, 1964
5.361
-0.009
-0.18%
jan 1, 1965
5.372
+0.011
0.2%
jan 1, 1966
5.402
+0.03
0.57%
jan 1, 1967
5.454
+0.052
0.97%
jan 1, 1968
5.527
+0.072
1.33%
jan 1, 1969
5.615
+0.088
1.59%
jan 1, 1970
5.711
+0.096
1.72%
jan 1, 1971
5.801
+0.091
1.58%
jan 1, 1972
5.882
+0.08
1.38%
jan 1, 1973
5.965
+0.083
1.41%
jan 1, 1974
6.052
+0.087
1.46%
jan 1, 1975
6.147
+0.095
1.57%
jan 1, 1976
6.252
+0.105
1.7%
jan 1, 1977
6.367
+0.115
1.85%
jan 1, 1978
6.491
+0.124
1.94%
jan 1, 1979
6.621
+0.13
2.0%
jan 1, 1980
6.696
+0.075
1.14%
jan 1, 1981
6.7
+0.004
0.06%
jan 1, 1982
6.7
+0.0
0.01%
jan 1, 1983
6.699
-0.001
-0.01%
jan 1, 1984
6.696
-0.003
-0.04%
jan 1, 1985
6.691
-0.005
-0.07%
jan 1, 1986
6.685
-0.007
-0.1%
jan 1, 1987
6.676
-0.009
-0.14%
jan 1, 1988
6.666
-0.009
-0.14%
jan 1, 1989
6.666
+0.0
0.0%
jan 1, 1990
6.613
-0.054
-0.8%
jan 1, 1991
6.607
-0.006
-0.08%
jan 1, 1992
6.6
-0.007
-0.1%
jan 1, 1993
6.639
+0.039
0.59%
jan 1, 1994
6.718
+0.079
1.19%
jan 1, 1995
6.852
+0.134
1.99%
jan 1, 1996
7.009
+0.158
2.3%
jan 1, 1997
7.154
+0.144
2.06%
jan 1, 1998
7.305
+0.152
2.12%
jan 1, 1999
7.471
+0.166
2.27%
jan 1, 2000
7.623
+0.152
2.03%
jan 1, 2001
7.792
+0.169
2.22%
jan 1, 2002
7.954
+0.162
2.08%
jan 1, 2003
8.105
+0.151
1.9%
jan 1, 2004
8.232
+0.127
1.56%
jan 1, 2005
8.331
+0.099
1.2%
jan 1, 2006
8.415
+0.083
1.0%
jan 1, 2007
8.485
+0.07
0.83%
jan 1, 2008
8.548
+0.063
0.75%
jan 1, 2009
8.606
+0.058
0.67%
jan 1, 2010
8.542
-0.064
-0.75%
jan 1, 2011
8.582
+0.041
0.47%
jan 1, 2012
8.621
+0.039
0.46%
jan 1, 2013
8.663
+0.041
0.48%
jan 1, 2014
8.701
+0.039
0.45%
jan 1, 2015
8.737
+0.035
0.41%
jan 1, 2016
8.679
-0.058
-0.66%
Ranking of countries by current statistics by years


Comments: