29
/
en
AIzaSyAYiBZKx7MnpbEhh9jyipgxe19OcubqV5w
April 1, 2024
240857
Singapore
SGP
true
2
1
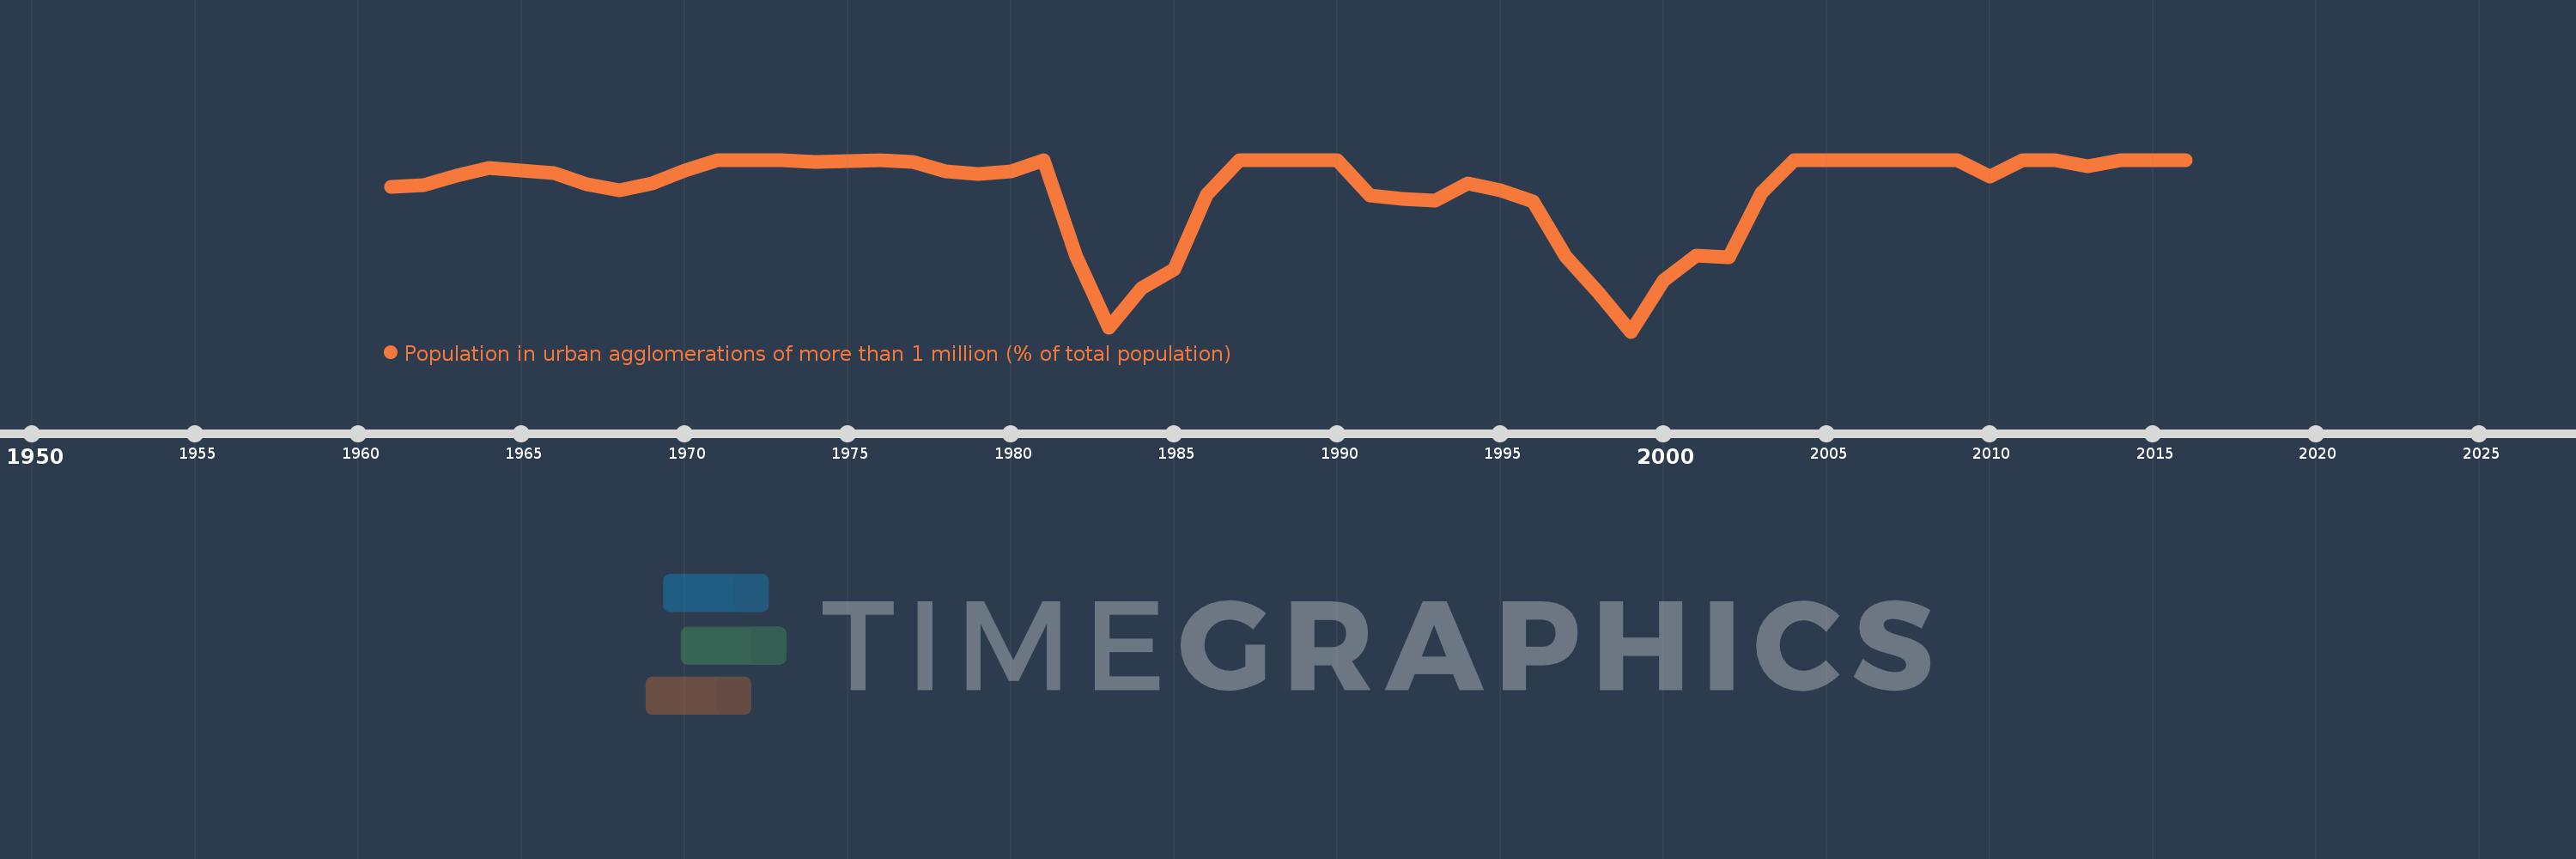
Population in urban agglomerations of more than 1 million (% of total population)
2016,2015,2014,2013,2012,2011,2010,2009,2008,2007,2006,2005,2004,2003,2002,2001,2000,1999,1998,1997,1996,1995,1994,1993,1992,1991,1990,1989,1988,1987,1986,1985,1984,1983,1982,1981,1980,1979,1978,1977,1976,1975,1974,1973,1972,1971,1970,1969,1968,1967,1966,1965,1964,1963,1962,1961
This statistics in other country:
Timeline:
This timeline shows a graph from 1961 to 2016 of Singapore. No data until 1960. Number of actual observations by date: 56.
Source name:
World Development Indicators
Source organization:
United Nations, World Urbanization Prospects.
Categories, topics:
Climate Change, Urban Development
Last updated:
apr 23, 2017
Indicators value changes by year
Minimum:
95.119
jan 1, 1999
At the date of observation
Value
Absolute change
Change from previous value
jan 1, 1961
99.23
+99.23
0.0%
jan 1, 1962
99.292
+0.063
0.06%
jan 1, 1963
99.559
+0.266
0.27%
jan 1, 1964
99.76
+0.201
0.2%
jan 1, 1965
99.701
-0.059
-0.06%
jan 1, 1966
99.612
-0.089
-0.09%
jan 1, 1967
99.313
-0.299
-0.3%
jan 1, 1968
99.138
-0.175
-0.18%
jan 1, 1969
99.336
+0.198
0.2%
jan 1, 1970
99.695
+0.359
0.36%
jan 1, 1971
99.979
+0.284
0.29%
jan 1, 1972
99.999
+0.019
0.02%
jan 1, 1973
100.0
+0.001
0.0%
jan 1, 1974
99.951
-0.049
-0.05%
jan 1, 1975
99.96
+0.009
0.01%
jan 1, 1976
99.991
+0.031
0.03%
jan 1, 1977
99.927
-0.064
-0.06%
jan 1, 1978
99.677
-0.249
-0.25%
jan 1, 1979
99.602
-0.076
-0.08%
jan 1, 1980
99.661
+0.059
0.06%
jan 1, 1981
100.0
+0.339
0.34%
jan 1, 1982
97.253
-2.747
-2.75%
jan 1, 1983
95.24
-2.012
-2.07%
jan 1, 1984
96.352
+1.111
1.17%
jan 1, 1985
96.88
+0.529
0.55%
jan 1, 1986
99.001
+2.121
2.19%
jan 1, 1987
100.0
+0.999
1.01%
jan 1, 1988
100.0
0.0
0.0%
jan 1, 1989
100.0
0.0
0.0%
jan 1, 1990
100.0
0.0
0.0%
jan 1, 1991
98.992
-1.008
-1.01%
jan 1, 1992
98.884
-0.108
-0.11%
jan 1, 1993
98.835
-0.049
-0.05%
jan 1, 1994
99.33
+0.496
0.5%
jan 1, 1995
99.125
-0.206
-0.21%
jan 1, 1996
98.812
-0.313
-0.32%
jan 1, 1997
97.259
-1.553
-1.57%
jan 1, 1998
96.236
-1.023
-1.05%
jan 1, 1999
95.119
-1.117
-1.16%
jan 1, 2000
96.562
+1.443
1.52%
jan 1, 2001
97.277
+0.714
0.74%
jan 1, 2002
97.227
-0.049
-0.05%
jan 1, 2003
99.049
+1.822
1.87%
jan 1, 2004
100.0
+0.951
0.96%
jan 1, 2005
100.0
0.0
0.0%
jan 1, 2006
100.0
0.0
0.0%
jan 1, 2007
100.0
0.0
0.0%
jan 1, 2008
100.0
0.0
0.0%
jan 1, 2009
100.0
0.0
0.0%
jan 1, 2010
99.534
-0.466
-0.47%
jan 1, 2011
100.0
+0.466
0.47%
jan 1, 2012
100.0
0.0
0.0%
jan 1, 2013
99.827
-0.173
-0.17%
jan 1, 2014
100.0
+0.173
0.17%
jan 1, 2015
100.0
0.0
0.0%
jan 1, 2016
100.0
0.0
0.0%
Ranking of countries by current statistics by years


Comments: