29
/
en
AIzaSyAYiBZKx7MnpbEhh9jyipgxe19OcubqV5w
April 1, 2024
230246
Russian Federation
RUS
true
2
1
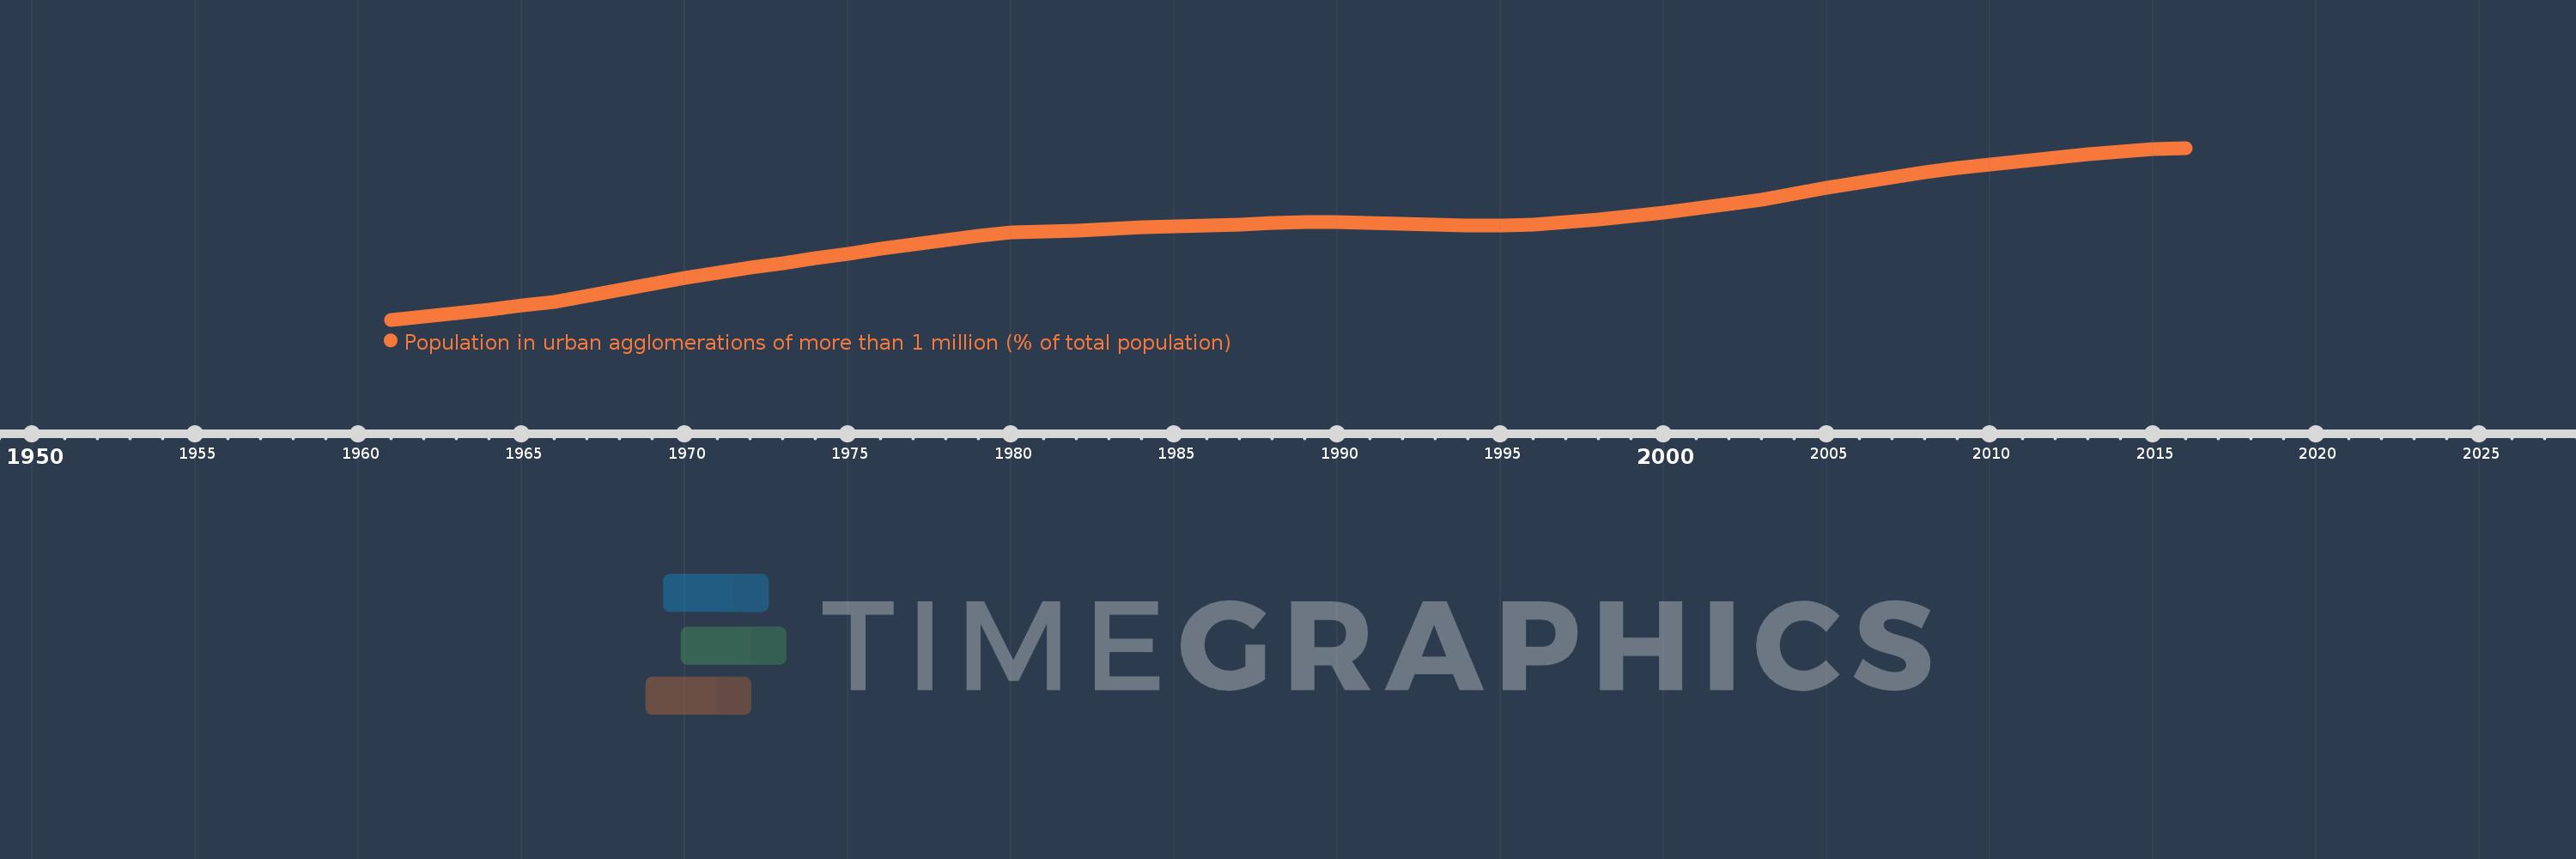
Population in urban agglomerations of more than 1 million (% of total population)
2016,2015,2014,2013,2012,2011,2010,2009,2008,2007,2006,2005,2004,2003,2002,2001,2000,1999,1998,1997,1996,1995,1994,1993,1992,1991,1990,1989,1988,1987,1986,1985,1984,1983,1982,1981,1980,1979,1978,1977,1976,1975,1974,1973,1972,1971,1970,1969,1968,1967,1966,1965,1964,1963,1962,1961
This statistics in other country:
Timeline:
This timeline shows a graph from 1961 to 2016 of Russian Federation. No data until 1960. Number of actual observations by date: 56.
Source name:
World Development Indicators
Source organization:
United Nations, World Urbanization Prospects.
Categories, topics:
Climate Change, Urban Development
Last updated:
apr 23, 2017
Indicators value changes by year
Minimum:
14.464
jan 1, 1961
Maximum:
20.882
jan 1, 2016
At the date of observation
Value
Absolute change
Change from previous value
jan 1, 1961
14.464
+14.464
0.0%
jan 1, 1962
14.591
+0.127
0.88%
jan 1, 1963
14.721
+0.129
0.89%
jan 1, 1964
14.852
+0.131
0.89%
jan 1, 1965
14.986
+0.134
0.9%
jan 1, 1966
15.12
+0.135
0.9%
jan 1, 1967
15.34
+0.22
1.45%
jan 1, 1968
15.564
+0.224
1.46%
jan 1, 1969
15.792
+0.228
1.47%
jan 1, 1970
16.024
+0.231
1.47%
jan 1, 1971
16.23
+0.207
1.29%
jan 1, 1972
16.404
+0.173
1.07%
jan 1, 1973
16.579
+0.176
1.07%
jan 1, 1974
16.756
+0.177
1.07%
jan 1, 1975
16.936
+0.18
1.07%
jan 1, 1976
17.118
+0.182
1.07%
jan 1, 1977
17.279
+0.162
0.94%
jan 1, 1978
17.442
+0.163
0.94%
jan 1, 1979
17.607
+0.165
0.94%
jan 1, 1980
17.716
+0.109
0.62%
jan 1, 1981
17.757
+0.041
0.23%
jan 1, 1982
17.806
+0.049
0.27%
jan 1, 1983
17.862
+0.056
0.31%
jan 1, 1984
17.924
+0.062
0.35%
jan 1, 1985
17.957
+0.034
0.19%
jan 1, 1986
17.987
+0.03
0.17%
jan 1, 1987
18.028
+0.041
0.23%
jan 1, 1988
18.072
+0.045
0.25%
jan 1, 1989
18.126
+0.054
0.3%
jan 1, 1990
18.12
-0.007
-0.04%
jan 1, 1991
18.068
-0.052
-0.29%
jan 1, 1992
18.046
-0.022
-0.12%
jan 1, 1993
18.021
-0.025
-0.14%
jan 1, 1994
17.989
-0.032
-0.18%
jan 1, 1995
17.996
+0.007
0.04%
jan 1, 1996
18.015
+0.019
0.1%
jan 1, 1997
18.098
+0.083
0.46%
jan 1, 1998
18.22
+0.122
0.67%
jan 1, 1999
18.334
+0.114
0.62%
jan 1, 2000
18.465
+0.131
0.72%
jan 1, 2001
18.625
+0.16
0.86%
jan 1, 2002
18.788
+0.163
0.88%
jan 1, 2003
18.961
+0.173
0.92%
jan 1, 2004
19.169
+0.207
1.09%
jan 1, 2005
19.381
+0.213
1.11%
jan 1, 2006
19.592
+0.211
1.09%
jan 1, 2007
19.796
+0.203
1.04%
jan 1, 2008
19.971
+0.175
0.88%
jan 1, 2009
20.122
+0.152
0.76%
jan 1, 2010
20.26
+0.138
0.68%
jan 1, 2011
20.396
+0.136
0.67%
jan 1, 2012
20.527
+0.131
0.64%
jan 1, 2013
20.641
+0.114
0.55%
jan 1, 2014
20.747
+0.106
0.51%
jan 1, 2015
20.853
+0.106
0.51%
jan 1, 2016
20.882
+0.029
0.14%
Ranking of countries by current statistics by years


Comments: