29
/
en
AIzaSyAYiBZKx7MnpbEhh9jyipgxe19OcubqV5w
April 1, 2024
228983
Romania
ROU
true
2
1
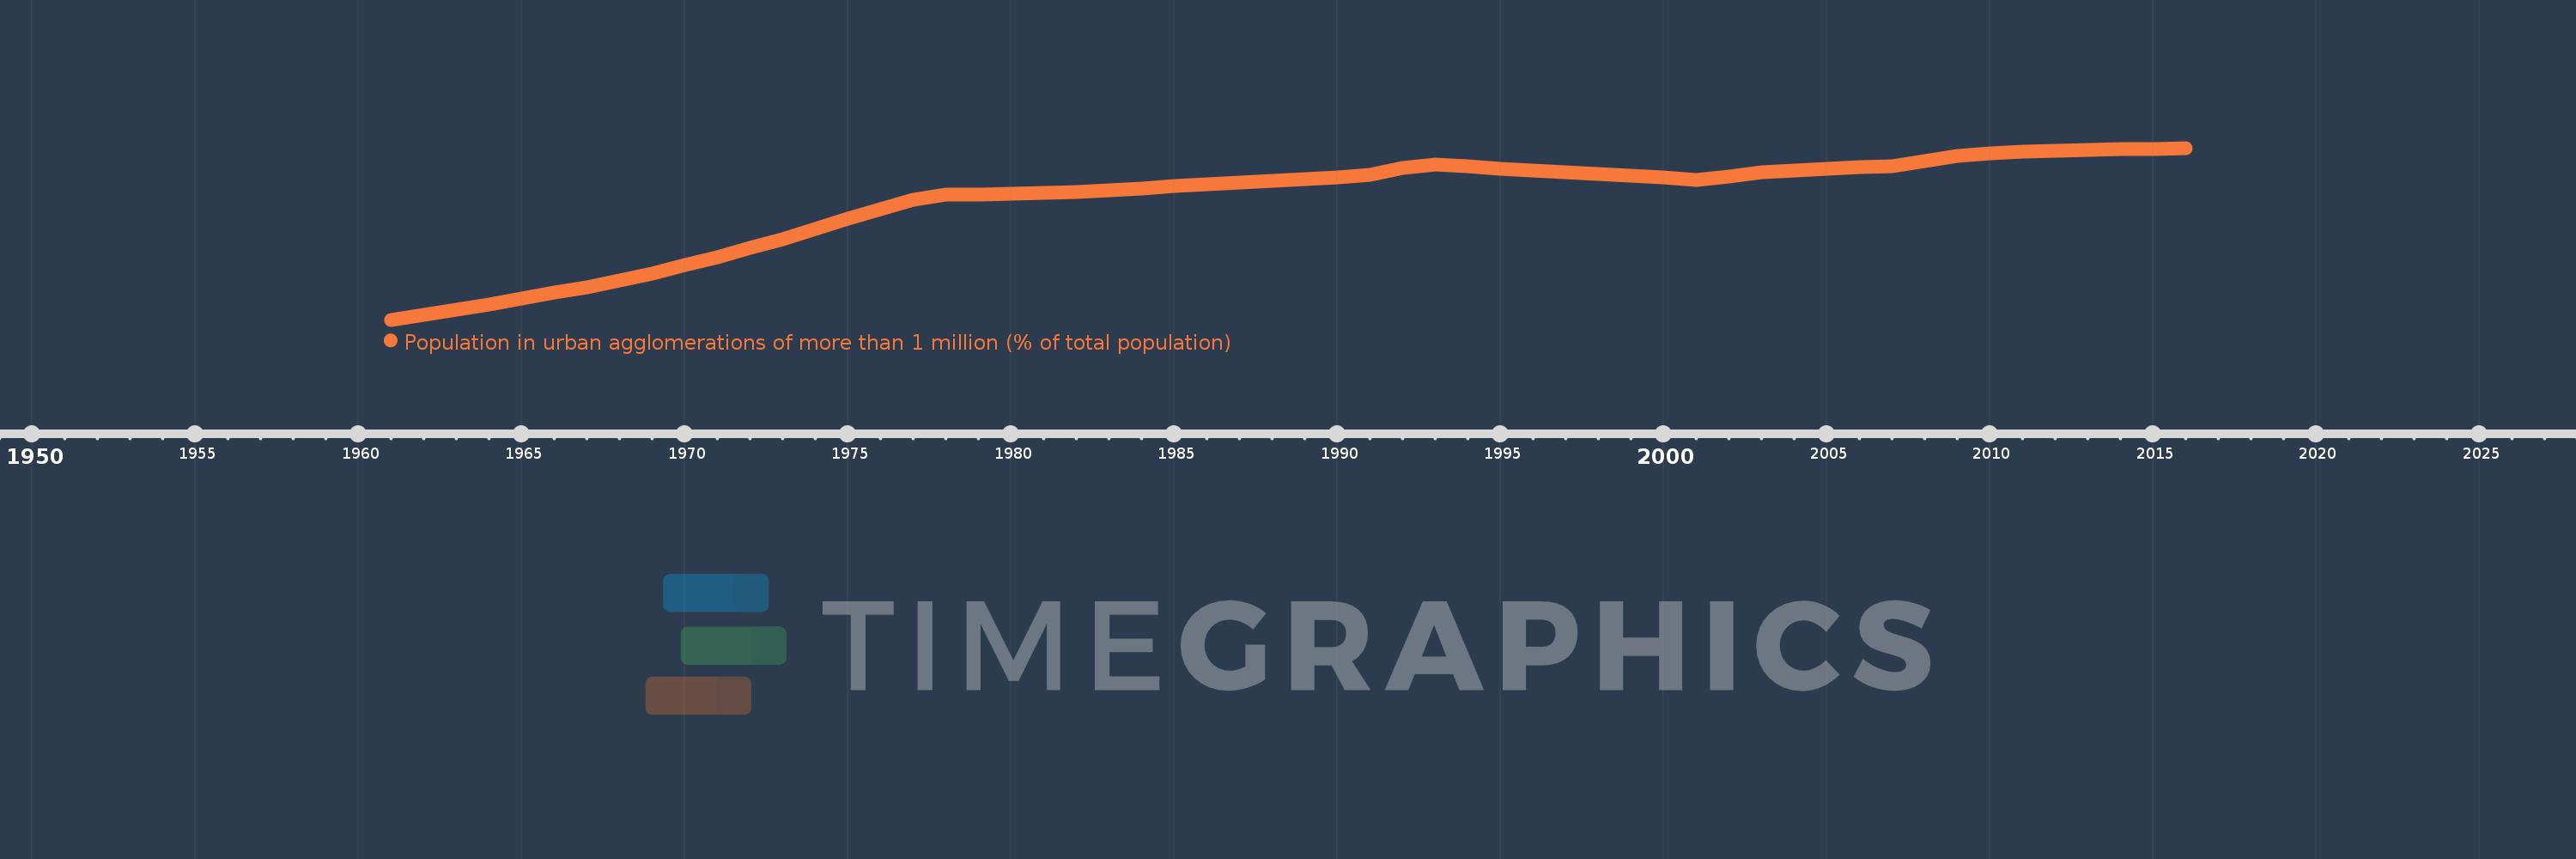
Population in urban agglomerations of more than 1 million (% of total population)
2016,2015,2014,2013,2012,2011,2010,2009,2008,2007,2006,2005,2004,2003,2002,2001,2000,1999,1998,1997,1996,1995,1994,1993,1992,1991,1990,1989,1988,1987,1986,1985,1984,1983,1982,1981,1980,1979,1978,1977,1976,1975,1974,1973,1972,1971,1970,1969,1968,1967,1966,1965,1964,1963,1962,1961
This statistics in other country:
Timeline:
This timeline shows a graph from 1961 to 2016 of Romania. No data until 1960. Number of actual observations by date: 56.
Source name:
World Development Indicators
Source organization:
United Nations, World Urbanization Prospects.
Categories, topics:
Climate Change, Urban Development
Last updated:
apr 23, 2017
Indicators value changes by year
At the date of observation
Value
Absolute change
Change from previous value
jan 1, 1961
5.445
+5.445
0.0%
jan 1, 1962
5.556
+0.111
2.04%
jan 1, 1963
5.679
+0.122
2.2%
jan 1, 1964
5.804
+0.125
2.2%
jan 1, 1965
5.932
+0.128
2.21%
jan 1, 1966
6.066
+0.134
2.26%
jan 1, 1967
6.201
+0.135
2.23%
jan 1, 1968
6.346
+0.145
2.34%
jan 1, 1969
6.514
+0.168
2.65%
jan 1, 1970
6.706
+0.192
2.95%
jan 1, 1971
6.894
+0.188
2.8%
jan 1, 1972
7.099
+0.204
2.97%
jan 1, 1973
7.316
+0.217
3.06%
jan 1, 1974
7.546
+0.23
3.15%
jan 1, 1975
7.778
+0.233
3.08%
jan 1, 1976
7.992
+0.214
2.75%
jan 1, 1977
8.216
+0.224
2.8%
jan 1, 1978
8.343
+0.127
1.55%
jan 1, 1979
8.343
+0.0
0.0%
jan 1, 1980
8.365
+0.022
0.27%
jan 1, 1981
8.383
+0.018
0.21%
jan 1, 1982
8.393
+0.01
0.12%
jan 1, 1983
8.431
+0.038
0.45%
jan 1, 1984
8.48
+0.048
0.57%
jan 1, 1985
8.531
+0.051
0.6%
jan 1, 1986
8.57
+0.039
0.46%
jan 1, 1987
8.608
+0.038
0.44%
jan 1, 1988
8.651
+0.043
0.5%
jan 1, 1989
8.688
+0.037
0.43%
jan 1, 1990
8.727
+0.039
0.45%
jan 1, 1991
8.79
+0.063
0.73%
jan 1, 1992
8.947
+0.157
1.78%
jan 1, 1993
9.04
+0.093
1.04%
jan 1, 1994
8.99
-0.05
-0.56%
jan 1, 1995
8.941
-0.049
-0.55%
jan 1, 1996
8.897
-0.044
-0.49%
jan 1, 1997
8.861
-0.036
-0.41%
jan 1, 1998
8.825
-0.036
-0.4%
jan 1, 1999
8.782
-0.043
-0.49%
jan 1, 2000
8.735
-0.047
-0.54%
jan 1, 2001
8.686
-0.049
-0.56%
jan 1, 2002
8.747
+0.061
0.7%
jan 1, 2003
8.859
+0.112
1.28%
jan 1, 2004
8.902
+0.043
0.49%
jan 1, 2005
8.932
+0.03
0.34%
jan 1, 2006
8.966
+0.034
0.38%
jan 1, 2007
8.998
+0.032
0.36%
jan 1, 2008
9.111
+0.112
1.25%
jan 1, 2009
9.242
+0.131
1.44%
jan 1, 2010
9.297
+0.055
0.6%
jan 1, 2011
9.331
+0.033
0.36%
jan 1, 2012
9.355
+0.024
0.26%
jan 1, 2013
9.375
+0.02
0.21%
jan 1, 2014
9.387
+0.013
0.14%
jan 1, 2015
9.4
+0.013
0.14%
jan 1, 2016
9.418
+0.017
0.18%
Ranking of countries by current statistics by years


Comments: