29
/
en
AIzaSyAYiBZKx7MnpbEhh9jyipgxe19OcubqV5w
April 1, 2024
45489
Low & middle income
LMY
false
2
1
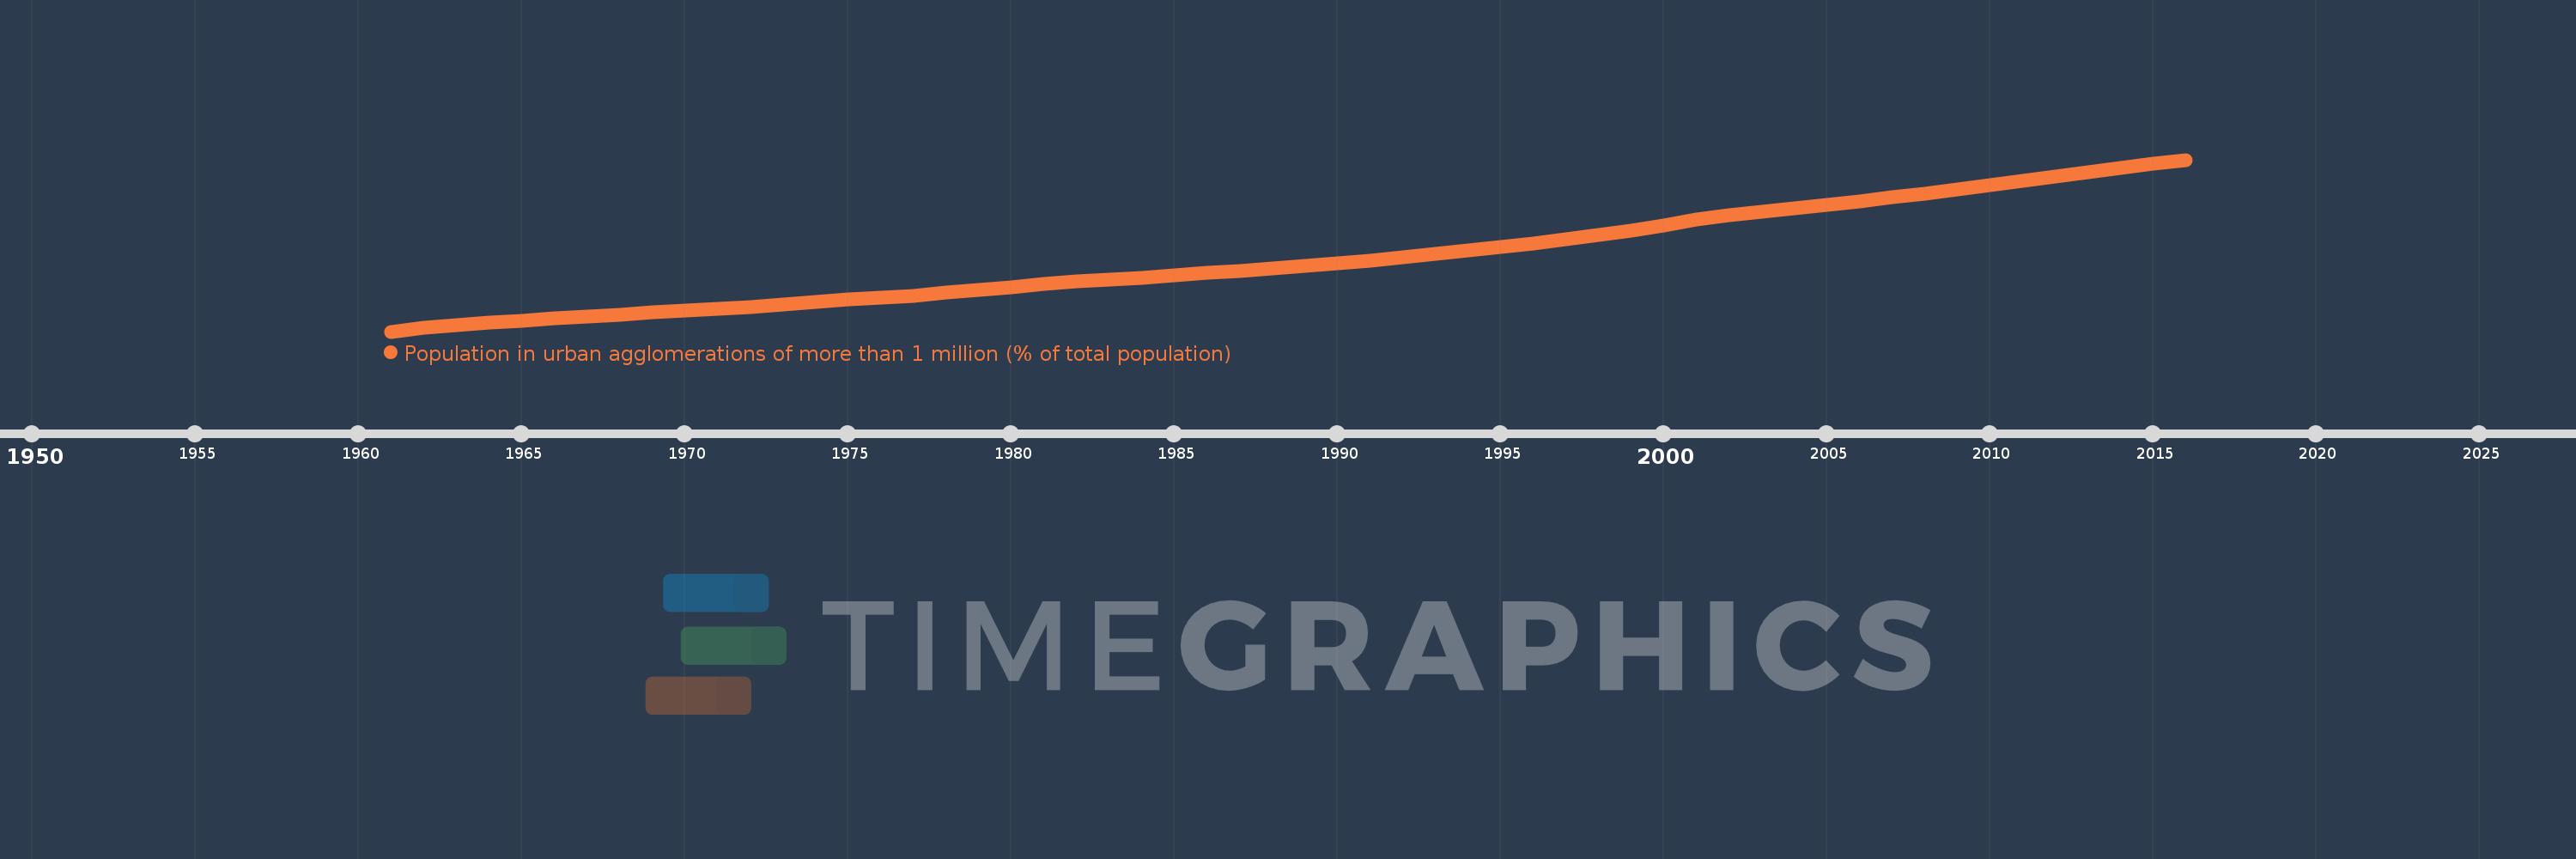
Population in urban agglomerations of more than 1 million (% of total population)
2016,2015,2014,2013,2012,2011,2010,2009,2008,2007,2006,2005,2004,2003,2002,2001,2000,1999,1998,1997,1996,1995,1994,1993,1992,1991,1990,1989,1988,1987,1986,1985,1984,1983,1982,1981,1980,1979,1978,1977,1976,1975,1974,1973,1972,1971,1970,1969,1968,1967,1966,1965,1964,1963,1962,1961
This statistics in other country:
Timeline:
This timeline shows a graph from 1961 to 2016 of Low & middle income. No data until 1960. Number of actual observations by date: 56.
Source name:
World Development Indicators
Source organization:
United Nations, World Urbanization Prospects.
Categories, topics:
Climate Change, Urban Development
Last updated:
apr 23, 2017
Indicators value changes by year
Maximum:
20.125
jan 1, 2016
At the date of observation
Value
Absolute change
Change from previous value
jan 1, 1961
9.614
+9.614
0.0%
jan 1, 1962
9.857
+0.243
2.53%
jan 1, 1963
10.027
+0.17
1.73%
jan 1, 1964
10.15
+0.123
1.23%
jan 1, 1965
10.286
+0.136
1.34%
jan 1, 1966
10.429
+0.143
1.39%
jan 1, 1967
10.548
+0.119
1.14%
jan 1, 1968
10.661
+0.113
1.07%
jan 1, 1969
10.778
+0.117
1.1%
jan 1, 1970
10.896
+0.118
1.09%
jan 1, 1971
11.014
+0.119
1.09%
jan 1, 1972
11.129
+0.115
1.05%
jan 1, 1973
11.267
+0.137
1.24%
jan 1, 1974
11.413
+0.146
1.29%
jan 1, 1975
11.566
+0.153
1.34%
jan 1, 1976
11.665
+0.099
0.86%
jan 1, 1977
11.821
+0.157
1.34%
jan 1, 1978
11.99
+0.168
1.42%
jan 1, 1979
12.169
+0.179
1.49%
jan 1, 1980
12.346
+0.177
1.45%
jan 1, 1981
12.525
+0.179
1.45%
jan 1, 1982
12.665
+0.14
1.12%
jan 1, 1983
12.781
+0.115
0.91%
jan 1, 1984
12.912
+0.132
1.03%
jan 1, 1985
13.053
+0.141
1.09%
jan 1, 1986
13.198
+0.145
1.11%
jan 1, 1987
13.345
+0.147
1.12%
jan 1, 1988
13.49
+0.146
1.09%
jan 1, 1989
13.644
+0.154
1.14%
jan 1, 1990
13.804
+0.16
1.17%
jan 1, 1991
13.976
+0.173
1.25%
jan 1, 1992
14.18
+0.204
1.46%
jan 1, 1993
14.366
+0.186
1.31%
jan 1, 1994
14.563
+0.197
1.37%
jan 1, 1995
14.777
+0.213
1.46%
jan 1, 1996
15.007
+0.23
1.56%
jan 1, 1997
15.263
+0.256
1.71%
jan 1, 1998
15.528
+0.265
1.73%
jan 1, 1999
15.814
+0.286
1.84%
jan 1, 2000
16.123
+0.309
1.96%
jan 1, 2001
16.462
+0.339
2.1%
jan 1, 2002
16.717
+0.254
1.55%
jan 1, 2003
16.927
+0.21
1.26%
jan 1, 2004
17.14
+0.214
1.26%
jan 1, 2005
17.355
+0.214
1.25%
jan 1, 2006
17.573
+0.218
1.26%
jan 1, 2007
17.817
+0.245
1.39%
jan 1, 2008
18.048
+0.231
1.3%
jan 1, 2009
18.308
+0.26
1.44%
jan 1, 2010
18.568
+0.26
1.42%
jan 1, 2011
18.826
+0.258
1.39%
jan 1, 2012
19.088
+0.262
1.39%
jan 1, 2013
19.349
+0.262
1.37%
jan 1, 2014
19.617
+0.268
1.38%
jan 1, 2015
19.895
+0.277
1.41%
jan 1, 2016
20.125
+0.231
1.16%
Ranking of countries by current statistics by years


Comments: