29
/
en
AIzaSyAYiBZKx7MnpbEhh9jyipgxe19OcubqV5w
April 1, 2024
33779
European Union
EUU
false
2
1
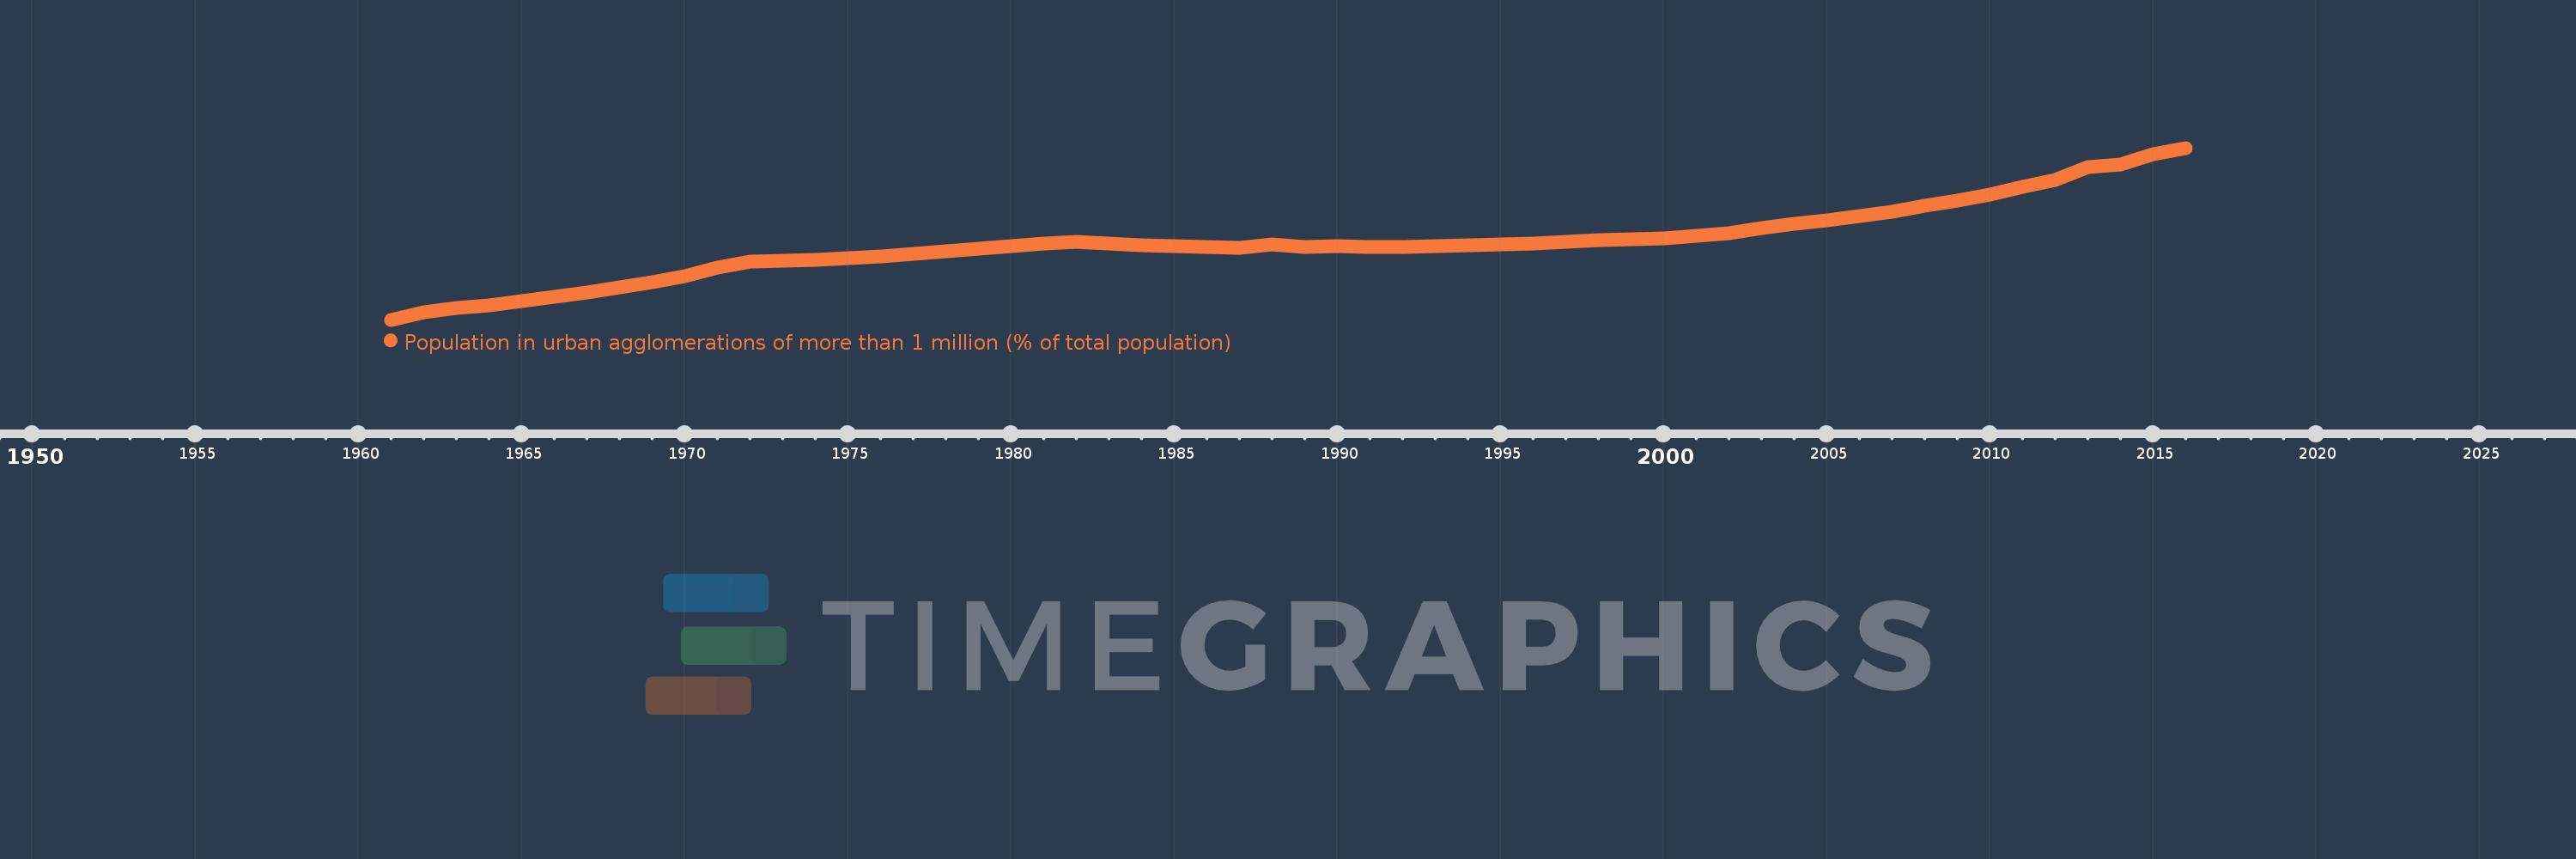
Population in urban agglomerations of more than 1 million (% of total population)
2016,2015,2014,2013,2012,2011,2010,2009,2008,2007,2006,2005,2004,2003,2002,2001,2000,1999,1998,1997,1996,1995,1994,1993,1992,1991,1990,1989,1988,1987,1986,1985,1984,1983,1982,1981,1980,1979,1978,1977,1976,1975,1974,1973,1972,1971,1970,1969,1968,1967,1966,1965,1964,1963,1962,1961
This statistics in other country:
Timeline:
This timeline shows a graph from 1961 to 2016 of European Union. No data until 1960. Number of actual observations by date: 56.
Source name:
World Development Indicators
Source organization:
United Nations, World Urbanization Prospects.
Categories, topics:
Climate Change, Urban Development
Last updated:
apr 23, 2017
Indicators value changes by year
Minimum:
16.125
jan 1, 1961
Maximum:
18.153
jan 1, 2016
At the date of observation
Value
Absolute change
Change from previous value
jan 1, 1961
16.125
+16.125
0.0%
jan 1, 1962
16.213
+0.089
0.55%
jan 1, 1963
16.263
+0.05
0.31%
jan 1, 1964
16.299
+0.036
0.22%
jan 1, 1965
16.341
+0.043
0.26%
jan 1, 1966
16.393
+0.051
0.31%
jan 1, 1967
16.447
+0.054
0.33%
jan 1, 1968
16.505
+0.058
0.35%
jan 1, 1969
16.573
+0.068
0.41%
jan 1, 1970
16.643
+0.07
0.42%
jan 1, 1971
16.737
+0.094
0.57%
jan 1, 1972
16.809
+0.072
0.43%
jan 1, 1973
16.824
+0.015
0.09%
jan 1, 1974
16.835
+0.011
0.06%
jan 1, 1975
16.855
+0.02
0.12%
jan 1, 1976
16.876
+0.021
0.12%
jan 1, 1977
16.902
+0.027
0.16%
jan 1, 1978
16.936
+0.033
0.2%
jan 1, 1979
16.965
+0.029
0.17%
jan 1, 1980
16.998
+0.033
0.19%
jan 1, 1981
17.025
+0.028
0.16%
jan 1, 1982
17.042
+0.016
0.1%
jan 1, 1983
17.023
-0.019
-0.11%
jan 1, 1984
17.006
-0.017
-0.1%
jan 1, 1985
16.991
-0.015
-0.09%
jan 1, 1986
16.98
-0.011
-0.06%
jan 1, 1987
16.976
-0.004
-0.03%
jan 1, 1988
17.014
+0.038
0.22%
jan 1, 1989
16.984
-0.029
-0.17%
jan 1, 1990
16.992
+0.008
0.05%
jan 1, 1991
16.985
-0.007
-0.04%
jan 1, 1992
16.987
+0.002
0.01%
jan 1, 1993
16.998
+0.011
0.07%
jan 1, 1994
17.005
+0.006
0.04%
jan 1, 1995
17.015
+0.011
0.06%
jan 1, 1996
17.029
+0.014
0.08%
jan 1, 1997
17.046
+0.017
0.1%
jan 1, 1998
17.06
+0.015
0.09%
jan 1, 1999
17.073
+0.013
0.08%
jan 1, 2000
17.087
+0.014
0.08%
jan 1, 2001
17.116
+0.029
0.17%
jan 1, 2002
17.144
+0.027
0.16%
jan 1, 2003
17.204
+0.06
0.35%
jan 1, 2004
17.254
+0.05
0.29%
jan 1, 2005
17.298
+0.044
0.25%
jan 1, 2006
17.345
+0.048
0.28%
jan 1, 2007
17.404
+0.059
0.34%
jan 1, 2008
17.467
+0.063
0.36%
jan 1, 2009
17.528
+0.061
0.35%
jan 1, 2010
17.603
+0.075
0.43%
jan 1, 2011
17.692
+0.089
0.51%
jan 1, 2012
17.777
+0.085
0.48%
jan 1, 2013
17.927
+0.149
0.84%
jan 1, 2014
17.953
+0.026
0.15%
jan 1, 2015
18.079
+0.126
0.7%
jan 1, 2016
18.153
+0.074
0.41%
Ranking of countries by current statistics by years


Comments: