29
/
en
AIzaSyAYiBZKx7MnpbEhh9jyipgxe19OcubqV5w
April 1, 2024
203406
Mozambique
MOZ
true
2
1
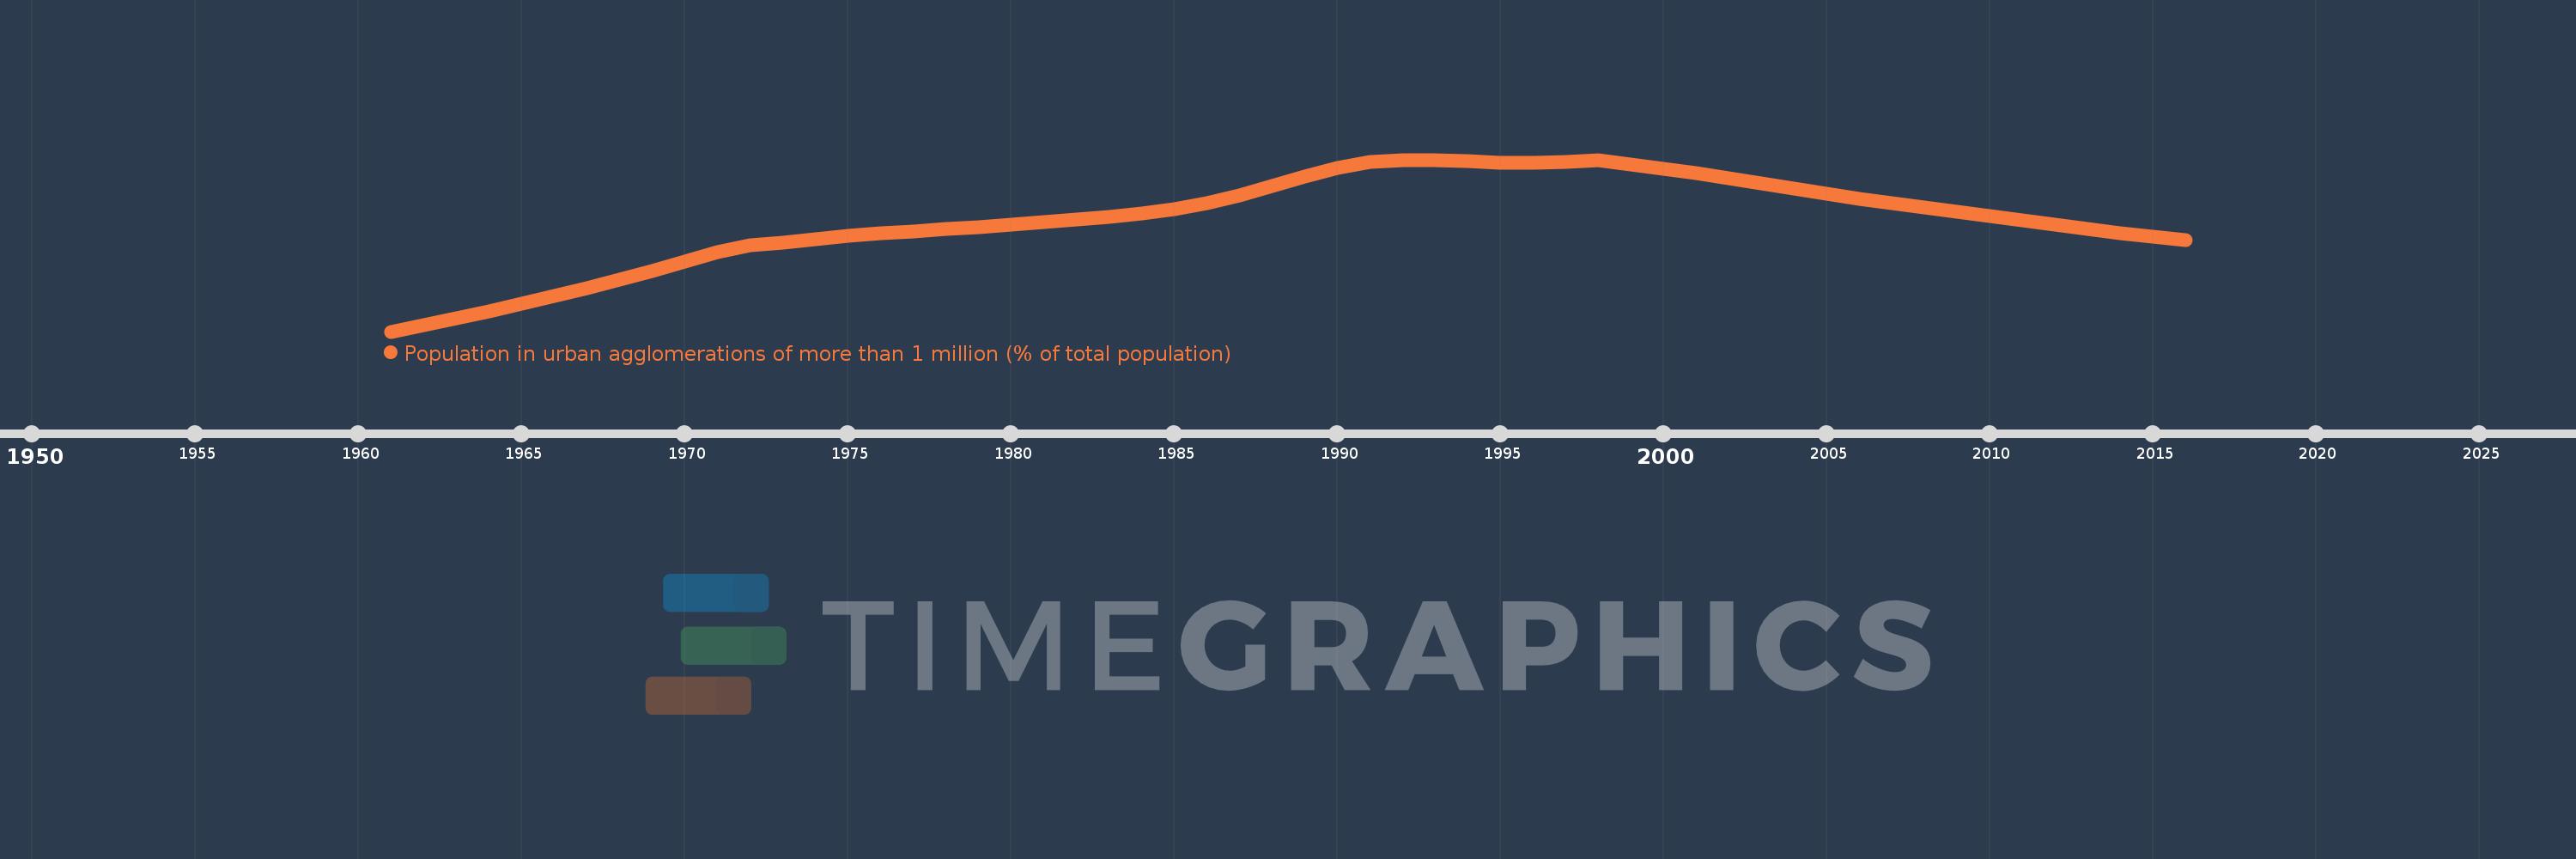
Population in urban agglomerations of more than 1 million (% of total population)
2016,2015,2014,2013,2012,2011,2010,2009,2008,2007,2006,2005,2004,2003,2002,2001,2000,1999,1998,1997,1996,1995,1994,1993,1992,1991,1990,1989,1988,1987,1986,1985,1984,1983,1982,1981,1980,1979,1978,1977,1976,1975,1974,1973,1972,1971,1970,1969,1968,1967,1966,1965,1964,1963,1962,1961
This statistics in other country:
Timeline:
This timeline shows a graph from 1961 to 2016 of Mozambique. No data until 1960. Number of actual observations by date: 56.
Source name:
World Development Indicators
Source organization:
United Nations, World Urbanization Prospects.
Categories, topics:
Climate Change, Urban Development
Last updated:
apr 23, 2017
Indicators value changes by year
At the date of observation
Value
Absolute change
Change from previous value
jan 1, 1961
2.418
+2.418
0.0%
jan 1, 1962
2.545
+0.127
5.24%
jan 1, 1963
2.68
+0.135
5.3%
jan 1, 1964
2.821
+0.141
5.26%
jan 1, 1965
2.969
+0.148
5.24%
jan 1, 1966
3.123
+0.154
5.19%
jan 1, 1967
3.285
+0.162
5.17%
jan 1, 1968
3.454
+0.169
5.14%
jan 1, 1969
3.631
+0.177
5.13%
jan 1, 1970
3.815
+0.185
5.09%
jan 1, 1971
4.01
+0.194
5.09%
jan 1, 1972
4.137
+0.127
3.18%
jan 1, 1973
4.203
+0.066
1.59%
jan 1, 1974
4.267
+0.064
1.52%
jan 1, 1975
4.326
+0.059
1.39%
jan 1, 1976
4.378
+0.053
1.21%
jan 1, 1977
4.424
+0.046
1.05%
jan 1, 1978
4.466
+0.041
0.93%
jan 1, 1979
4.507
+0.041
0.93%
jan 1, 1980
4.554
+0.047
1.04%
jan 1, 1981
4.61
+0.056
1.23%
jan 1, 1982
4.658
+0.048
1.04%
jan 1, 1983
4.711
+0.054
1.15%
jan 1, 1984
4.779
+0.067
1.43%
jan 1, 1985
4.869
+0.09
1.89%
jan 1, 1986
4.987
+0.118
2.42%
jan 1, 1987
5.14
+0.154
3.08%
jan 1, 1988
5.325
+0.185
3.59%
jan 1, 1989
5.519
+0.194
3.64%
jan 1, 1990
5.687
+0.168
3.03%
jan 1, 1991
5.802
+0.115
2.02%
jan 1, 1992
5.852
+0.05
0.87%
jan 1, 1993
5.85
-0.002
-0.03%
jan 1, 1994
5.82
-0.03
-0.52%
jan 1, 1995
5.793
-0.027
-0.46%
jan 1, 1996
5.788
-0.005
-0.08%
jan 1, 1997
5.809
+0.021
0.36%
jan 1, 1998
5.847
+0.038
0.65%
jan 1, 1999
5.766
-0.08
-1.37%
jan 1, 2000
5.675
-0.091
-1.58%
jan 1, 2001
5.579
-0.096
-1.7%
jan 1, 2002
5.477
-0.102
-1.82%
jan 1, 2003
5.374
-0.103
-1.89%
jan 1, 2004
5.271
-0.103
-1.92%
jan 1, 2005
5.17
-0.101
-1.91%
jan 1, 2006
5.073
-0.097
-1.87%
jan 1, 2007
4.981
-0.093
-1.82%
jan 1, 2008
4.891
-0.089
-1.79%
jan 1, 2009
4.805
-0.087
-1.77%
jan 1, 2010
4.719
-0.085
-1.77%
jan 1, 2011
4.635
-0.084
-1.78%
jan 1, 2012
4.552
-0.083
-1.79%
jan 1, 2013
4.471
-0.082
-1.79%
jan 1, 2014
4.391
-0.08
-1.79%
jan 1, 2015
4.314
-0.077
-1.76%
jan 1, 2016
4.243
-0.07
-1.63%
Ranking of countries by current statistics by years


Comments: