29
/
en
AIzaSyAYiBZKx7MnpbEhh9jyipgxe19OcubqV5w
April 1, 2024
130964
Ethiopia
ETH
true
2
1
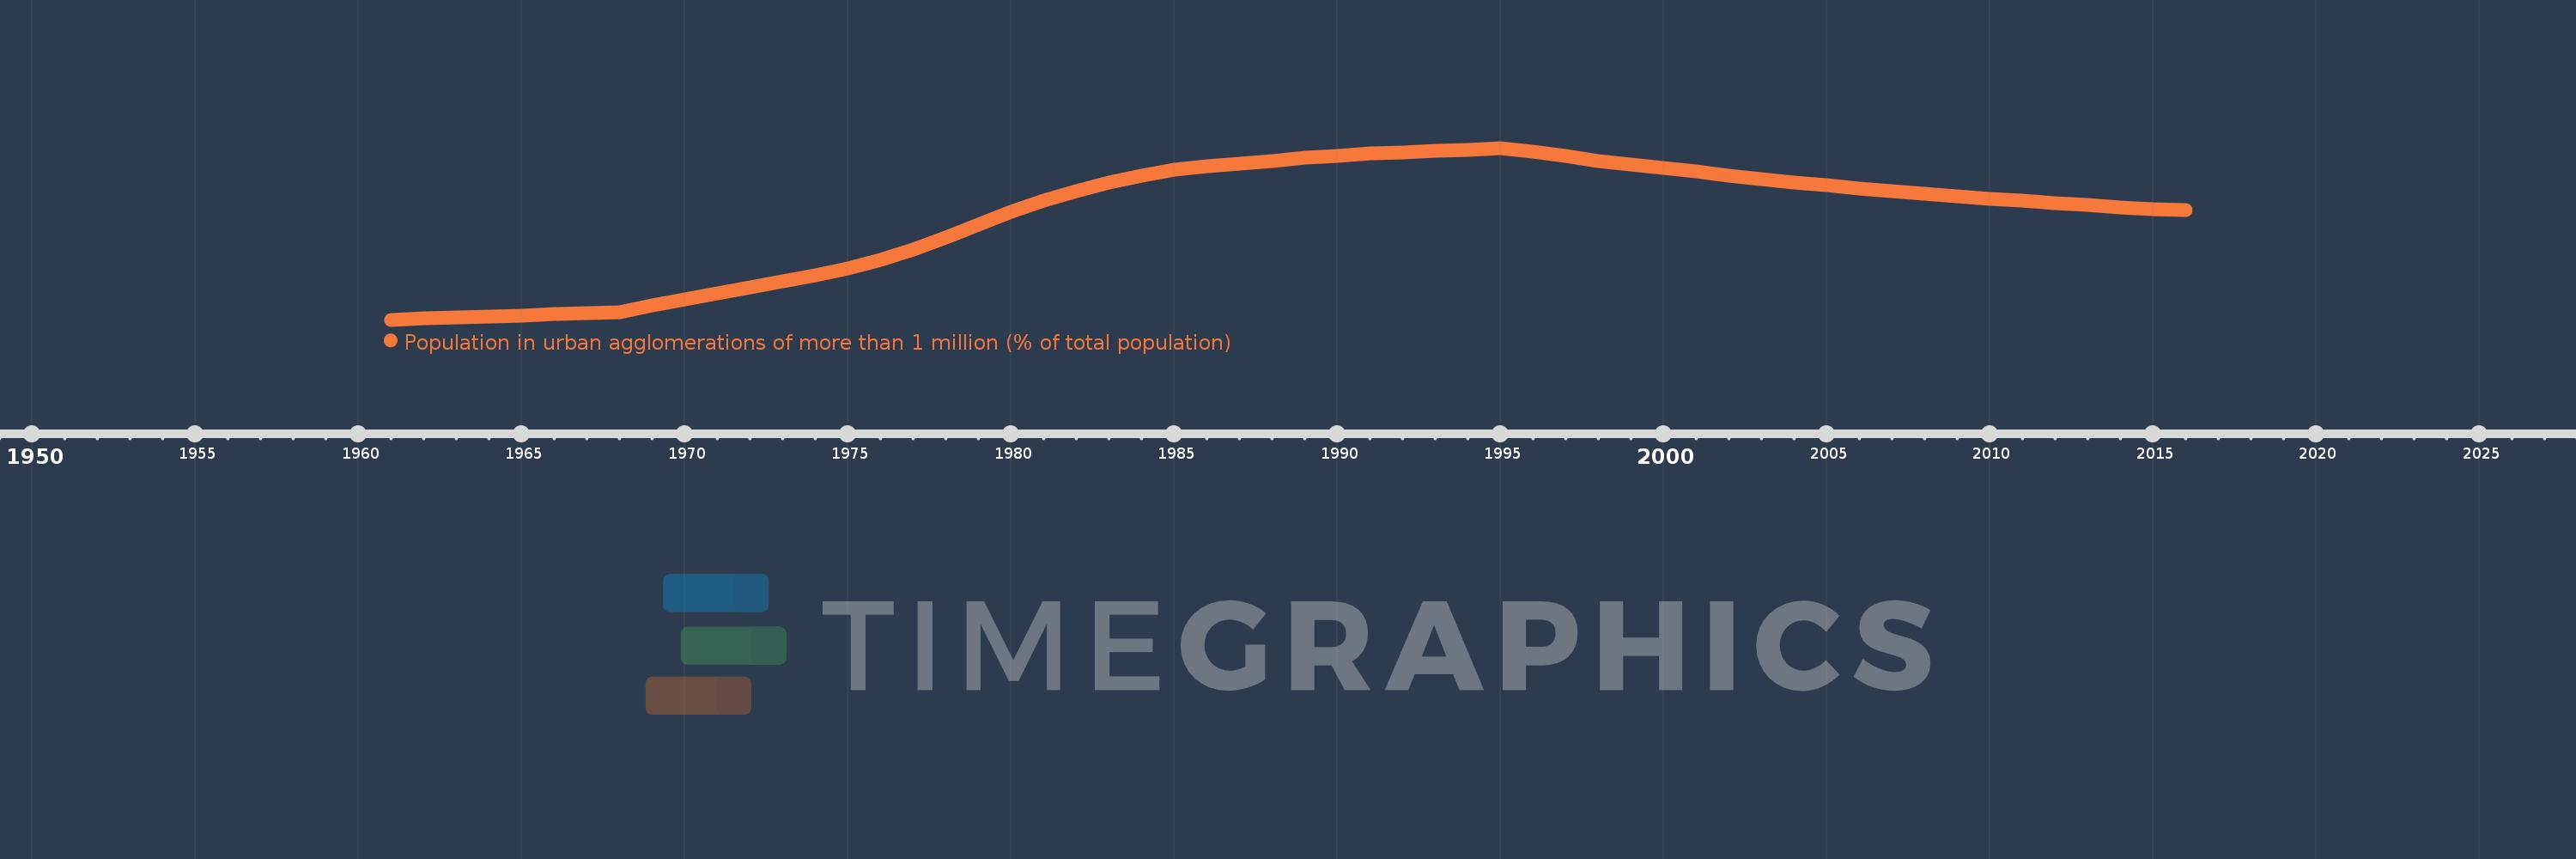
Population in urban agglomerations of more than 1 million (% of total population)
2016,2015,2014,2013,2012,2011,2010,2009,2008,2007,2006,2005,2004,2003,2002,2001,2000,1999,1998,1997,1996,1995,1994,1993,1992,1991,1990,1989,1988,1987,1986,1985,1984,1983,1982,1981,1980,1979,1978,1977,1976,1975,1974,1973,1972,1971,1970,1969,1968,1967,1966,1965,1964,1963,1962,1961
This statistics in other country:
Timeline:
This timeline shows a graph from 1961 to 2016 of Ethiopia. No data until 1960. Number of actual observations by date: 56.
Source name:
World Development Indicators
Source organization:
United Nations, World Urbanization Prospects.
Categories, topics:
Climate Change, Urban Development
Last updated:
apr 23, 2017
Indicators value changes by year
At the date of observation
Value
Absolute change
Change from previous value
jan 1, 1961
2.344
+2.344
0.0%
jan 1, 1962
2.355
+0.011
0.49%
jan 1, 1963
2.365
+0.01
0.41%
jan 1, 1964
2.373
+0.008
0.36%
jan 1, 1965
2.381
+0.008
0.33%
jan 1, 1966
2.389
+0.007
0.31%
jan 1, 1967
2.396
+0.008
0.33%
jan 1, 1968
2.405
+0.008
0.35%
jan 1, 1969
2.46
+0.055
2.31%
jan 1, 1970
2.514
+0.054
2.19%
jan 1, 1971
2.566
+0.052
2.08%
jan 1, 1972
2.615
+0.049
1.91%
jan 1, 1973
2.662
+0.047
1.8%
jan 1, 1974
2.712
+0.05
1.86%
jan 1, 1975
2.771
+0.059
2.17%
jan 1, 1976
2.842
+0.072
2.59%
jan 1, 1977
2.93
+0.087
3.07%
jan 1, 1978
3.03
+0.1
3.41%
jan 1, 1979
3.137
+0.107
3.53%
jan 1, 1980
3.241
+0.104
3.32%
jan 1, 1981
3.335
+0.094
2.9%
jan 1, 1982
3.415
+0.08
2.4%
jan 1, 1983
3.484
+0.069
2.01%
jan 1, 1984
3.544
+0.06
1.73%
jan 1, 1985
3.597
+0.053
1.48%
jan 1, 1986
3.621
+0.024
0.66%
jan 1, 1987
3.645
+0.024
0.68%
jan 1, 1988
3.669
+0.024
0.65%
jan 1, 1989
3.692
+0.023
0.61%
jan 1, 1990
3.711
+0.019
0.52%
jan 1, 1991
3.727
+0.016
0.43%
jan 1, 1992
3.739
+0.012
0.33%
jan 1, 1993
3.749
+0.011
0.28%
jan 1, 1994
3.76
+0.011
0.29%
jan 1, 1995
3.775
+0.015
0.39%
jan 1, 1996
3.746
-0.029
-0.76%
jan 1, 1997
3.705
-0.041
-1.1%
jan 1, 1998
3.669
-0.036
-0.97%
jan 1, 1999
3.637
-0.032
-0.87%
jan 1, 2000
3.607
-0.03
-0.84%
jan 1, 2001
3.577
-0.03
-0.83%
jan 1, 2002
3.547
-0.03
-0.83%
jan 1, 2003
3.518
-0.029
-0.82%
jan 1, 2004
3.49
-0.028
-0.8%
jan 1, 2005
3.464
-0.027
-0.76%
jan 1, 2006
3.438
-0.025
-0.72%
jan 1, 2007
3.415
-0.023
-0.68%
jan 1, 2008
3.393
-0.022
-0.64%
jan 1, 2009
3.372
-0.021
-0.61%
jan 1, 2010
3.352
-0.02
-0.59%
jan 1, 2011
3.333
-0.019
-0.56%
jan 1, 2012
3.315
-0.018
-0.54%
jan 1, 2013
3.299
-0.017
-0.51%
jan 1, 2014
3.282
-0.016
-0.49%
jan 1, 2015
3.267
-0.015
-0.46%
jan 1, 2016
3.257
-0.01
-0.31%
Ranking of countries by current statistics by years


Comments: