29
/
en
AIzaSyAYiBZKx7MnpbEhh9jyipgxe19OcubqV5w
April 1, 2024
167998
Kenya
KEN
true
2
1
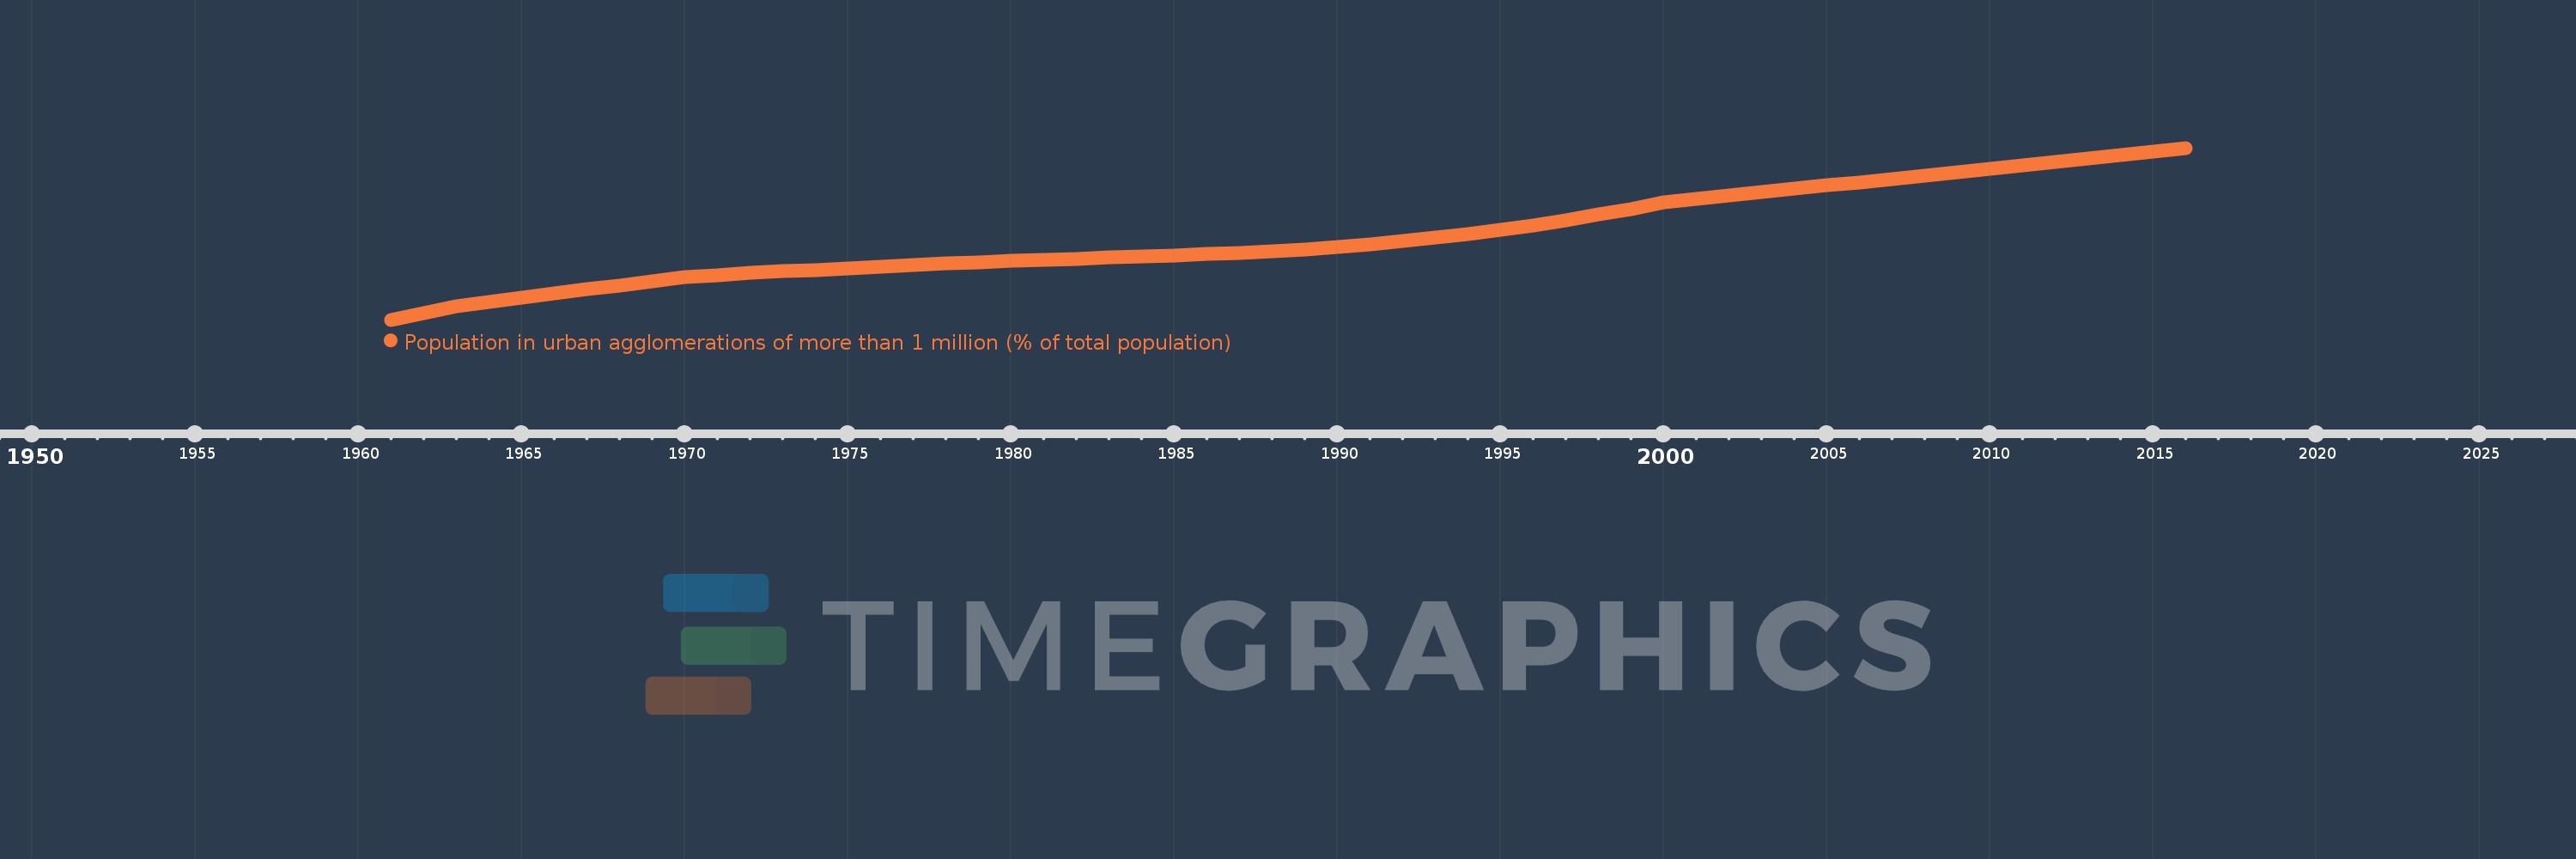
Population in urban agglomerations of more than 1 million (% of total population)
2016,2015,2014,2013,2012,2011,2010,2009,2008,2007,2006,2005,2004,2003,2002,2001,2000,1999,1998,1997,1996,1995,1994,1993,1992,1991,1990,1989,1988,1987,1986,1985,1984,1983,1982,1981,1980,1979,1978,1977,1976,1975,1974,1973,1972,1971,1970,1969,1968,1967,1966,1965,1964,1963,1962,1961
This statistics in other country:
Timeline:
This timeline shows a graph from 1961 to 2016 of Kenya. No data until 1960. Number of actual observations by date: 56.
Source name:
World Development Indicators
Source organization:
United Nations, World Urbanization Prospects.
Categories, topics:
Climate Change, Urban Development
Last updated:
apr 23, 2017
Indicators value changes by year
Maximum:
10.898
jan 1, 2016
At the date of observation
Value
Absolute change
Change from previous value
jan 1, 1961
5.588
+5.588
0.0%
jan 1, 1962
5.796
+0.208
3.73%
jan 1, 1963
6.011
+0.215
3.71%
jan 1, 1964
6.148
+0.136
2.27%
jan 1, 1965
6.274
+0.126
2.05%
jan 1, 1966
6.399
+0.126
2.0%
jan 1, 1967
6.526
+0.127
1.98%
jan 1, 1968
6.653
+0.127
1.94%
jan 1, 1969
6.78
+0.127
1.91%
jan 1, 1970
6.905
+0.125
1.84%
jan 1, 1971
6.973
+0.069
0.99%
jan 1, 1972
7.029
+0.056
0.8%
jan 1, 1973
7.083
+0.054
0.76%
jan 1, 1974
7.133
+0.05
0.71%
jan 1, 1975
7.182
+0.049
0.69%
jan 1, 1976
7.23
+0.048
0.67%
jan 1, 1977
7.278
+0.048
0.66%
jan 1, 1978
7.324
+0.046
0.64%
jan 1, 1979
7.371
+0.046
0.63%
jan 1, 1980
7.415
+0.045
0.61%
jan 1, 1981
7.449
+0.033
0.45%
jan 1, 1982
7.478
+0.03
0.4%
jan 1, 1983
7.508
+0.03
0.4%
jan 1, 1984
7.54
+0.032
0.42%
jan 1, 1985
7.576
+0.036
0.47%
jan 1, 1986
7.615
+0.039
0.52%
jan 1, 1987
7.66
+0.045
0.59%
jan 1, 1988
7.711
+0.051
0.66%
jan 1, 1989
7.768
+0.057
0.74%
jan 1, 1990
7.831
+0.063
0.81%
jan 1, 1991
7.917
+0.087
1.11%
jan 1, 1992
8.014
+0.096
1.22%
jan 1, 1993
8.118
+0.104
1.3%
jan 1, 1994
8.231
+0.113
1.4%
jan 1, 1995
8.359
+0.127
1.55%
jan 1, 1996
8.501
+0.143
1.71%
jan 1, 1997
8.661
+0.159
1.87%
jan 1, 1998
8.833
+0.173
1.99%
jan 1, 1999
9.017
+0.184
2.08%
jan 1, 2000
9.206
+0.189
2.1%
jan 1, 2001
9.326
+0.12
1.31%
jan 1, 2002
9.431
+0.105
1.12%
jan 1, 2003
9.534
+0.103
1.09%
jan 1, 2004
9.636
+0.102
1.07%
jan 1, 2005
9.738
+0.102
1.06%
jan 1, 2006
9.84
+0.102
1.05%
jan 1, 2007
9.943
+0.103
1.05%
jan 1, 2008
10.047
+0.104
1.04%
jan 1, 2009
10.151
+0.104
1.04%
jan 1, 2010
10.254
+0.103
1.01%
jan 1, 2011
10.357
+0.103
1.01%
jan 1, 2012
10.46
+0.103
1.0%
jan 1, 2013
10.564
+0.104
0.99%
jan 1, 2014
10.67
+0.106
1.0%
jan 1, 2015
10.779
+0.109
1.03%
jan 1, 2016
10.898
+0.118
1.1%
Ranking of countries by current statistics by years


Comments: