29
/
en
AIzaSyAYiBZKx7MnpbEhh9jyipgxe19OcubqV5w
April 1, 2024
46496
Low income
LIC
false
2
1
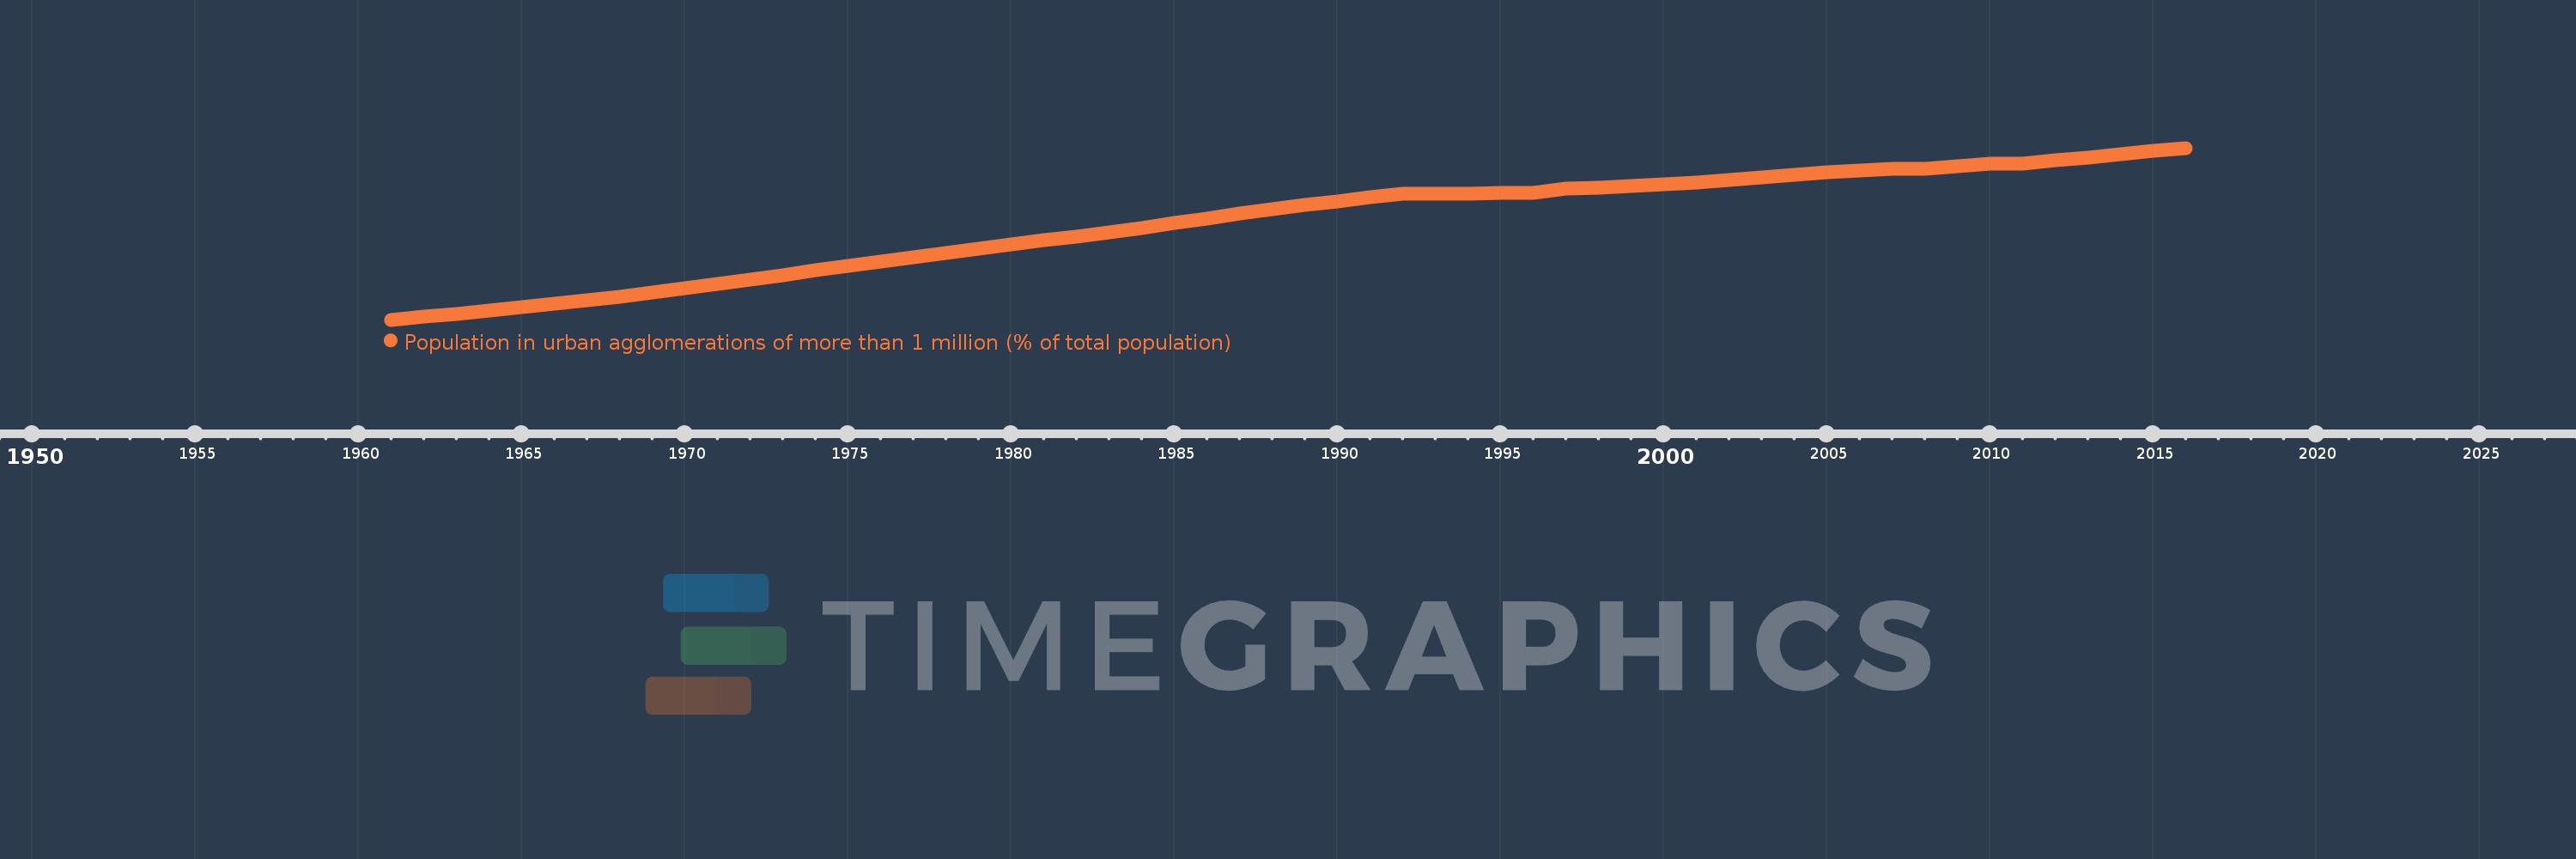
Population in urban agglomerations of more than 1 million (% of total population)
2016,2015,2014,2013,2012,2011,2010,2009,2008,2007,2006,2005,2004,2003,2002,2001,2000,1999,1998,1997,1996,1995,1994,1993,1992,1991,1990,1989,1988,1987,1986,1985,1984,1983,1982,1981,1980,1979,1978,1977,1976,1975,1974,1973,1972,1971,1970,1969,1968,1967,1966,1965,1964,1963,1962,1961
This statistics in other country:
Timeline:
This timeline shows a graph from 1961 to 2016 of Low income. No data until 1960. Number of actual observations by date: 56.
Source name:
World Development Indicators
Source organization:
United Nations, World Urbanization Prospects.
Categories, topics:
Climate Change, Urban Development
Last updated:
apr 23, 2017
Indicators value changes by year
Maximum:
11.203
jan 1, 2016
At the date of observation
Value
Absolute change
Change from previous value
jan 1, 1961
3.564
+3.564
0.0%
jan 1, 1962
3.694
+0.13
3.64%
jan 1, 1963
3.83
+0.136
3.68%
jan 1, 1964
3.965
+0.135
3.53%
jan 1, 1965
4.11
+0.145
3.66%
jan 1, 1966
4.262
+0.151
3.69%
jan 1, 1967
4.42
+0.158
3.71%
jan 1, 1968
4.586
+0.167
3.77%
jan 1, 1969
4.769
+0.182
3.97%
jan 1, 1970
4.965
+0.196
4.11%
jan 1, 1971
5.162
+0.197
3.97%
jan 1, 1972
5.353
+0.19
3.69%
jan 1, 1973
5.552
+0.2
3.73%
jan 1, 1974
5.751
+0.198
3.57%
jan 1, 1975
5.941
+0.19
3.31%
jan 1, 1976
6.136
+0.195
3.28%
jan 1, 1977
6.331
+0.195
3.18%
jan 1, 1978
6.527
+0.196
3.1%
jan 1, 1979
6.726
+0.199
3.05%
jan 1, 1980
6.915
+0.188
2.8%
jan 1, 1981
7.098
+0.183
2.65%
jan 1, 1982
7.267
+0.169
2.39%
jan 1, 1983
7.445
+0.178
2.45%
jan 1, 1984
7.649
+0.204
2.74%
jan 1, 1985
7.864
+0.215
2.81%
jan 1, 1986
8.071
+0.206
2.62%
jan 1, 1987
8.274
+0.203
2.52%
jan 1, 1988
8.472
+0.198
2.4%
jan 1, 1989
8.66
+0.188
2.22%
jan 1, 1990
8.837
+0.178
2.05%
jan 1, 1991
9.01
+0.173
1.96%
jan 1, 1992
9.177
+0.167
1.85%
jan 1, 1993
9.176
-0.002
-0.02%
jan 1, 1994
9.178
+0.002
0.02%
jan 1, 1995
9.187
+0.009
0.1%
jan 1, 1996
9.202
+0.016
0.17%
jan 1, 1997
9.378
+0.175
1.91%
jan 1, 1998
9.442
+0.064
0.68%
jan 1, 1999
9.507
+0.065
0.69%
jan 1, 2000
9.571
+0.063
0.67%
jan 1, 2001
9.678
+0.107
1.12%
jan 1, 2002
9.786
+0.108
1.12%
jan 1, 2003
9.903
+0.117
1.19%
jan 1, 2004
10.011
+0.109
1.1%
jan 1, 2005
10.125
+0.113
1.13%
jan 1, 2006
10.187
+0.062
0.61%
jan 1, 2007
10.267
+0.08
0.79%
jan 1, 2008
10.262
-0.005
-0.05%
jan 1, 2009
10.375
+0.113
1.11%
jan 1, 2010
10.51
+0.135
1.3%
jan 1, 2011
10.521
+0.011
0.1%
jan 1, 2012
10.652
+0.13
1.24%
jan 1, 2013
10.786
+0.135
1.26%
jan 1, 2014
10.926
+0.14
1.29%
jan 1, 2015
11.072
+0.146
1.34%
jan 1, 2016
11.203
+0.131
1.18%
Ranking of countries by current statistics by years


Comments: