29
/
en
AIzaSyAYiBZKx7MnpbEhh9jyipgxe19OcubqV5w
April 1, 2024
268492
Tunisia
TUN
true
2
1
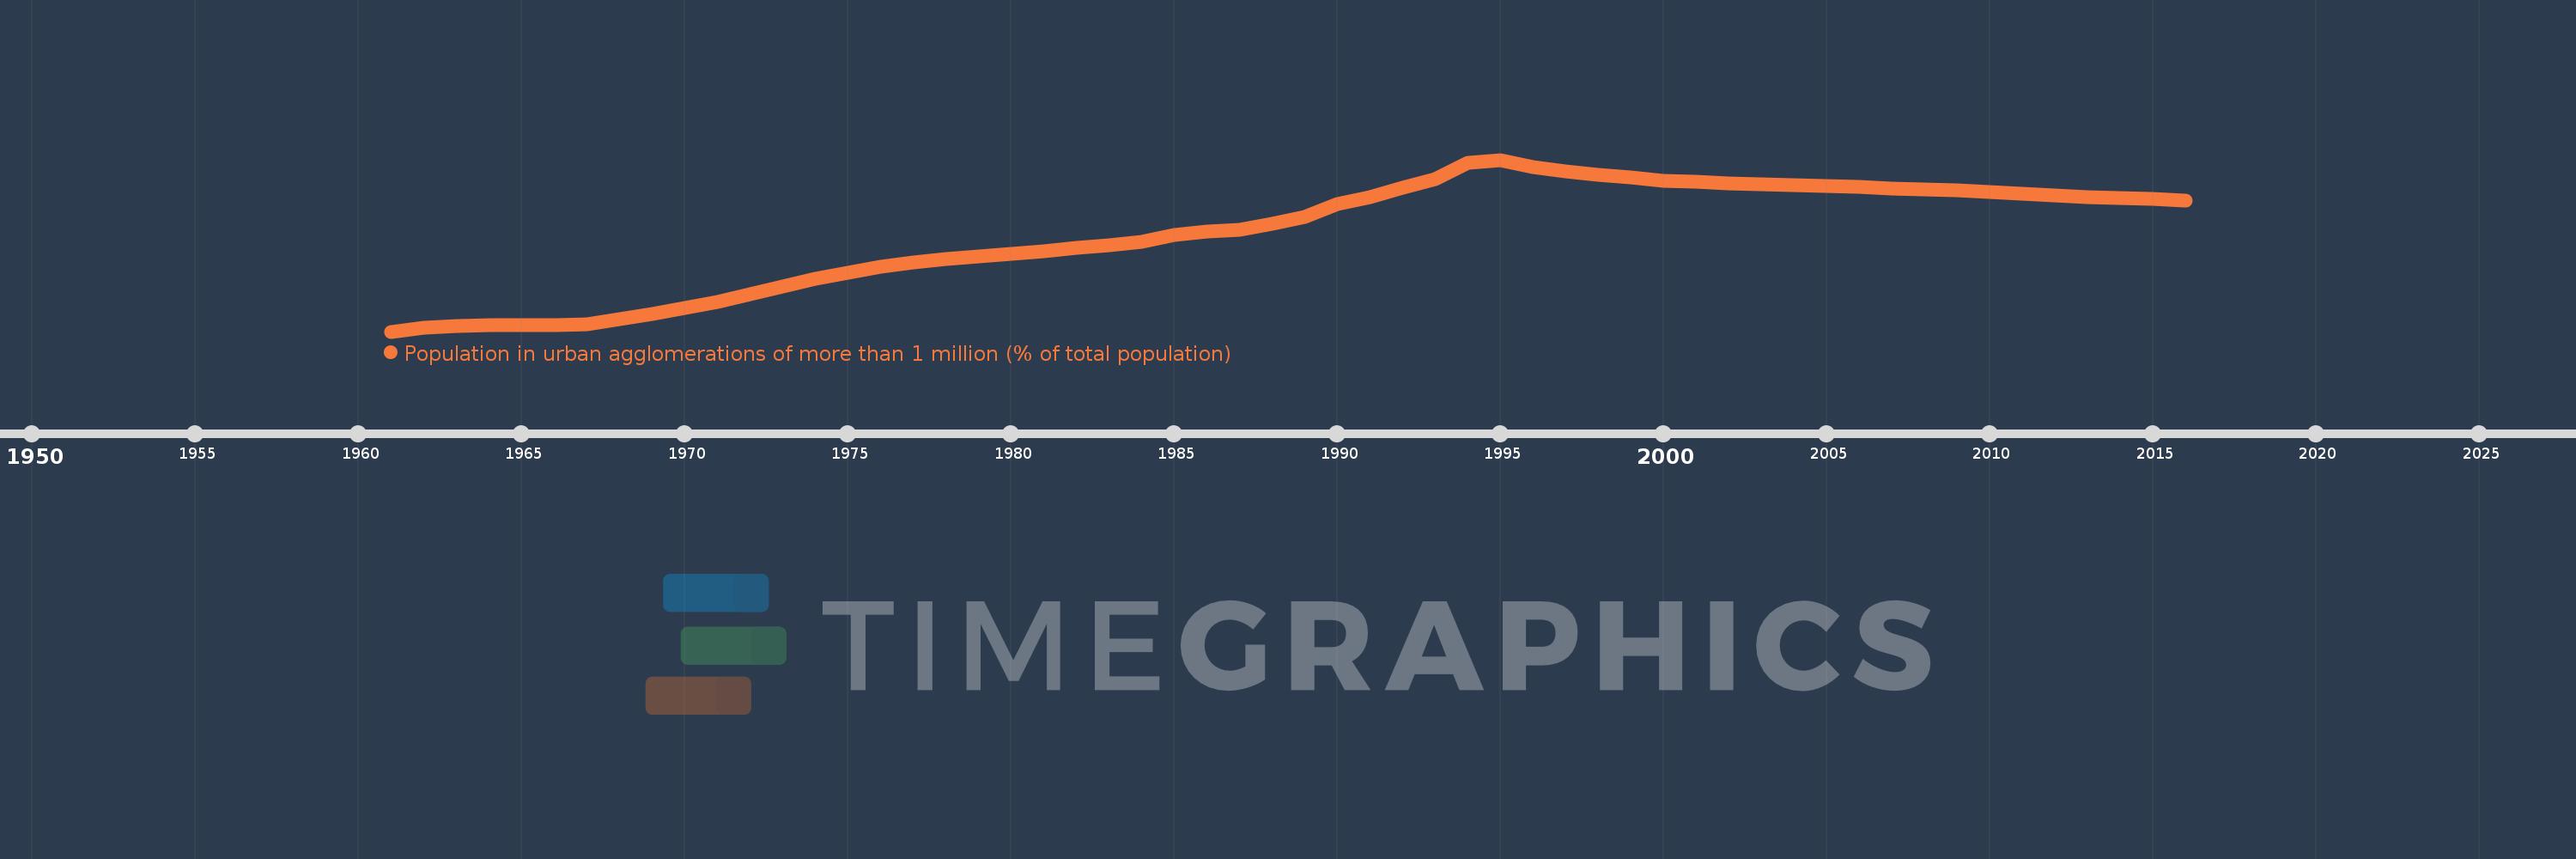
Population in urban agglomerations of more than 1 million (% of total population)
2016,2015,2014,2013,2012,2011,2010,2009,2008,2007,2006,2005,2004,2003,2002,2001,2000,1999,1998,1997,1996,1995,1994,1993,1992,1991,1990,1989,1988,1987,1986,1985,1984,1983,1982,1981,1980,1979,1978,1977,1976,1975,1974,1973,1972,1971,1970,1969,1968,1967,1966,1965,1964,1963,1962,1961
This statistics in other country:
Timeline:
This timeline shows a graph from 1961 to 2016 of Tunisia. No data until 1960. Number of actual observations by date: 56.
Source name:
World Development Indicators
Source organization:
United Nations, World Urbanization Prospects.
Categories, topics:
Climate Change, Urban Development
Last updated:
apr 23, 2017
Indicators value changes by year
Minimum:
13.938
jan 1, 1961
Maximum:
19.197
jan 1, 1995
At the date of observation
Value
Absolute change
Change from previous value
jan 1, 1961
13.938
+13.938
0.0%
jan 1, 1962
14.051
+0.113
0.81%
jan 1, 1963
14.113
+0.062
0.44%
jan 1, 1964
14.14
+0.027
0.19%
jan 1, 1965
14.147
+0.007
0.05%
jan 1, 1966
14.143
-0.003
-0.02%
jan 1, 1967
14.164
+0.021
0.15%
jan 1, 1968
14.316
+0.152
1.07%
jan 1, 1969
14.48
+0.164
1.15%
jan 1, 1970
14.657
+0.177
1.22%
jan 1, 1971
14.849
+0.192
1.31%
jan 1, 1972
15.091
+0.242
1.63%
jan 1, 1973
15.327
+0.236
1.56%
jan 1, 1974
15.546
+0.219
1.43%
jan 1, 1975
15.743
+0.197
1.27%
jan 1, 1976
15.913
+0.17
1.08%
jan 1, 1977
16.054
+0.14
0.88%
jan 1, 1978
16.159
+0.105
0.65%
jan 1, 1979
16.241
+0.083
0.51%
jan 1, 1980
16.319
+0.078
0.48%
jan 1, 1981
16.404
+0.085
0.52%
jan 1, 1982
16.493
+0.088
0.54%
jan 1, 1983
16.587
+0.094
0.57%
jan 1, 1984
16.688
+0.101
0.61%
jan 1, 1985
16.908
+0.22
1.32%
jan 1, 1986
16.99
+0.082
0.49%
jan 1, 1987
17.056
+0.066
0.39%
jan 1, 1988
17.228
+0.172
1.01%
jan 1, 1989
17.457
+0.228
1.32%
jan 1, 1990
17.854
+0.398
2.28%
jan 1, 1991
18.053
+0.199
1.11%
jan 1, 1992
18.334
+0.281
1.56%
jan 1, 1993
18.611
+0.277
1.51%
jan 1, 1994
19.095
+0.484
2.6%
jan 1, 1995
19.197
+0.102
0.54%
jan 1, 1996
18.98
-0.218
-1.13%
jan 1, 1997
18.854
-0.125
-0.66%
jan 1, 1998
18.746
-0.108
-0.58%
jan 1, 1999
18.656
-0.09
-0.48%
jan 1, 2000
18.561
-0.095
-0.51%
jan 1, 2001
18.521
-0.041
-0.22%
jan 1, 2002
18.479
-0.042
-0.23%
jan 1, 2003
18.439
-0.04
-0.22%
jan 1, 2004
18.414
-0.024
-0.13%
jan 1, 2005
18.389
-0.026
-0.14%
jan 1, 2006
18.357
-0.031
-0.17%
jan 1, 2007
18.324
-0.034
-0.18%
jan 1, 2008
18.295
-0.029
-0.16%
jan 1, 2009
18.256
-0.039
-0.21%
jan 1, 2010
18.207
-0.049
-0.27%
jan 1, 2011
18.166
-0.041
-0.23%
jan 1, 2012
18.094
-0.072
-0.4%
jan 1, 2013
18.063
-0.031
-0.17%
jan 1, 2014
18.026
-0.038
-0.21%
jan 1, 2015
17.988
-0.038
-0.21%
jan 1, 2016
17.947
-0.041
-0.23%
Ranking of countries by current statistics by years


Comments: