29
/
en
AIzaSyAYiBZKx7MnpbEhh9jyipgxe19OcubqV5w
April 1, 2024
149575
Haiti
HTI
true
2
1
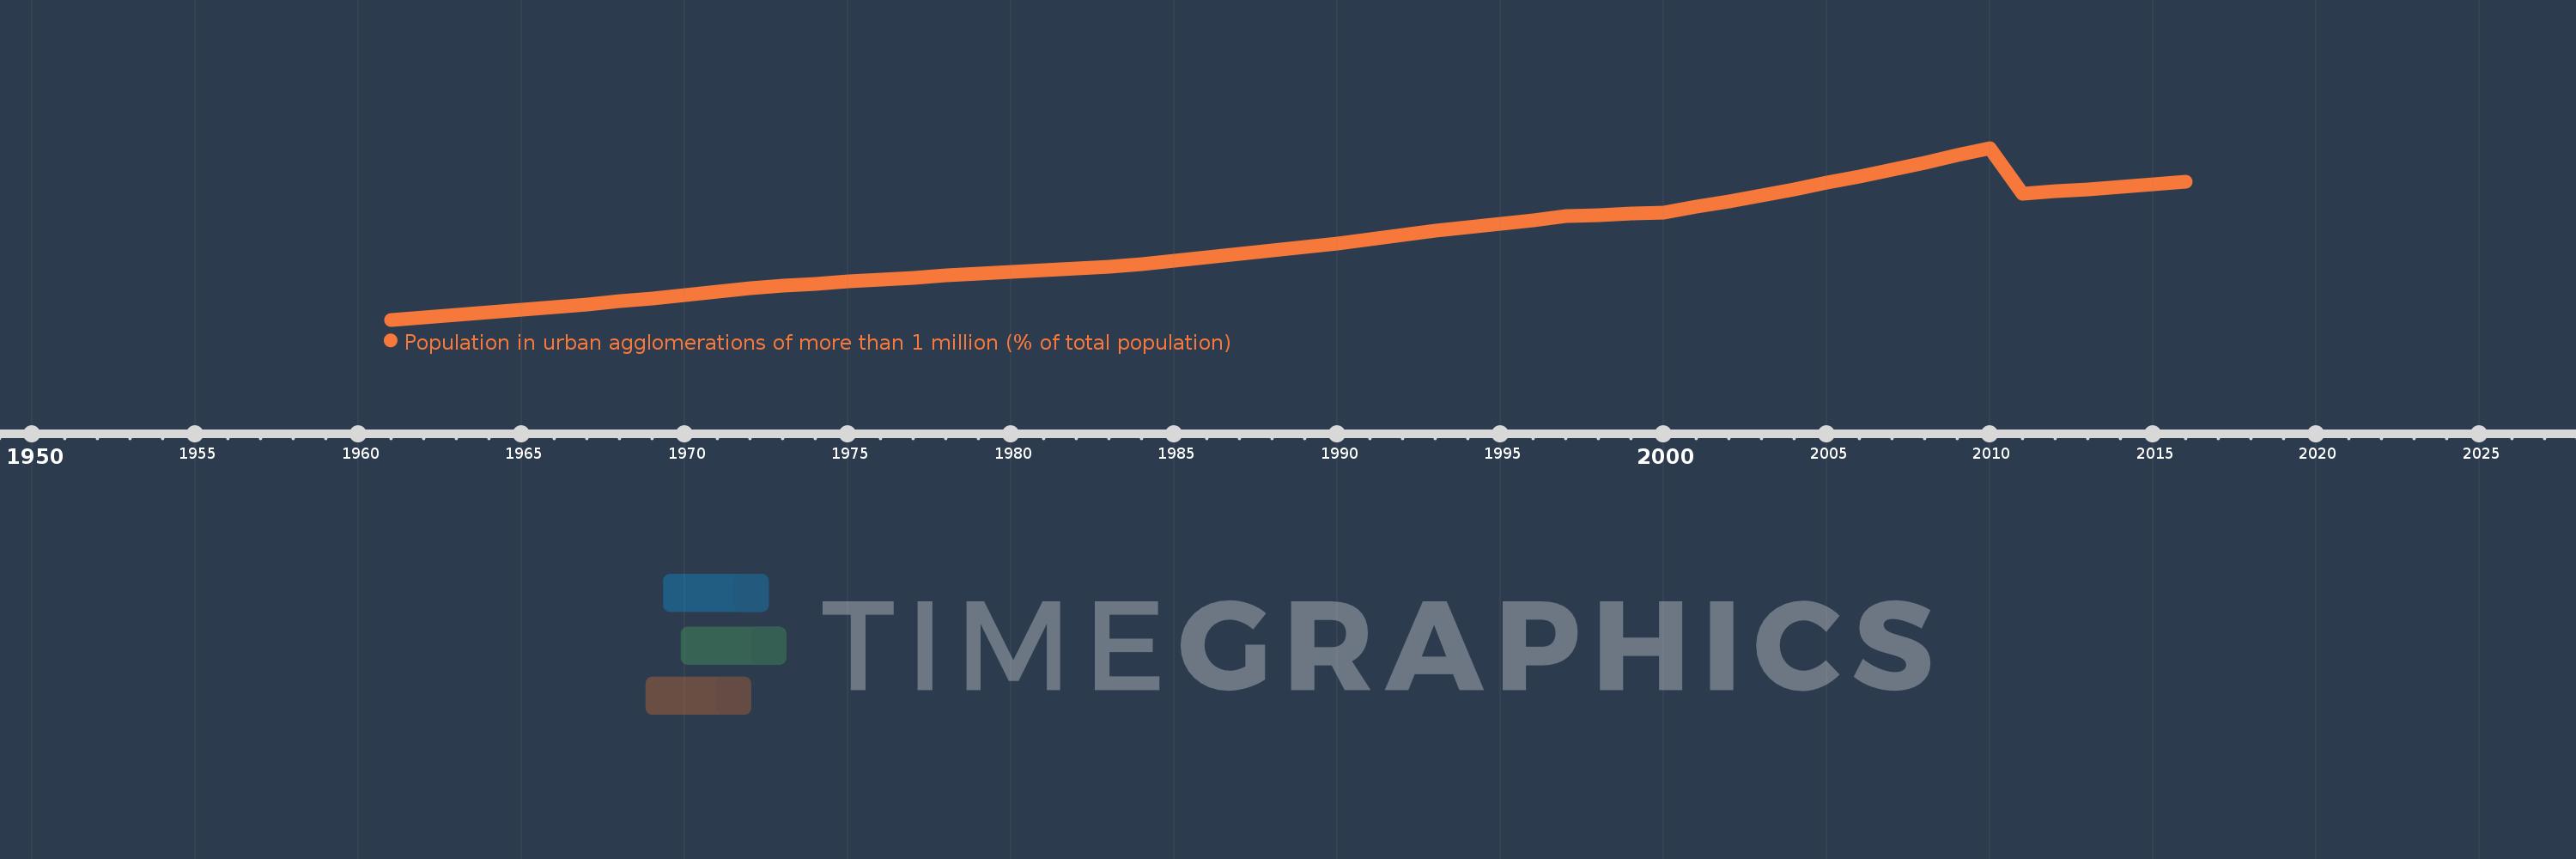
Population in urban agglomerations of more than 1 million (% of total population)
2016,2015,2014,2013,2012,2011,2010,2009,2008,2007,2006,2005,2004,2003,2002,2001,2000,1999,1998,1997,1996,1995,1994,1993,1992,1991,1990,1989,1988,1987,1986,1985,1984,1983,1982,1981,1980,1979,1978,1977,1976,1975,1974,1973,1972,1971,1970,1969,1968,1967,1966,1965,1964,1963,1962,1961
This statistics in other country:
Timeline:
This timeline shows a graph from 1961 to 2016 of Haiti. No data until 1960. Number of actual observations by date: 56.
Source name:
World Development Indicators
Source organization:
United Nations, World Urbanization Prospects.
Categories, topics:
Climate Change, Urban Development
Last updated:
apr 23, 2017
Indicators value changes by year
Maximum:
26.822
jan 1, 2010
At the date of observation
Value
Absolute change
Change from previous value
jan 1, 1961
6.402
+6.402
0.0%
jan 1, 1962
6.676
+0.275
4.29%
jan 1, 1963
6.963
+0.286
4.29%
jan 1, 1964
7.261
+0.298
4.28%
jan 1, 1965
7.572
+0.311
4.29%
jan 1, 1966
7.895
+0.323
4.27%
jan 1, 1967
8.233
+0.338
4.28%
jan 1, 1968
8.585
+0.352
4.28%
jan 1, 1969
8.955
+0.37
4.31%
jan 1, 1970
9.345
+0.39
4.35%
jan 1, 1971
9.759
+0.414
4.43%
jan 1, 1972
10.199
+0.44
4.51%
jan 1, 1973
10.469
+0.27
2.64%
jan 1, 1974
10.706
+0.237
2.27%
jan 1, 1975
10.945
+0.239
2.24%
jan 1, 1976
11.182
+0.237
2.17%
jan 1, 1977
11.417
+0.235
2.1%
jan 1, 1978
11.648
+0.231
2.02%
jan 1, 1979
11.875
+0.227
1.95%
jan 1, 1980
12.097
+0.222
1.87%
jan 1, 1981
12.315
+0.218
1.8%
jan 1, 1982
12.526
+0.21
1.71%
jan 1, 1983
12.732
+0.207
1.65%
jan 1, 1984
13.058
+0.326
2.56%
jan 1, 1985
13.42
+0.362
2.77%
jan 1, 1986
13.798
+0.377
2.81%
jan 1, 1987
14.194
+0.397
2.88%
jan 1, 1988
14.611
+0.416
2.93%
jan 1, 1989
15.047
+0.437
2.99%
jan 1, 1990
15.502
+0.454
3.02%
jan 1, 1991
15.976
+0.475
3.06%
jan 1, 1992
16.472
+0.495
3.1%
jan 1, 1993
16.99
+0.519
3.15%
jan 1, 1994
17.395
+0.405
2.38%
jan 1, 1995
17.816
+0.421
2.42%
jan 1, 1996
18.252
+0.436
2.45%
jan 1, 1997
18.704
+0.452
2.48%
jan 1, 1998
18.85
+0.146
0.78%
jan 1, 1999
19.004
+0.154
0.82%
jan 1, 2000
19.167
+0.163
0.86%
jan 1, 2001
19.808
+0.642
3.35%
jan 1, 2002
20.478
+0.67
3.38%
jan 1, 2003
21.18
+0.702
3.43%
jan 1, 2004
21.913
+0.733
3.46%
jan 1, 2005
22.662
+0.748
3.42%
jan 1, 2006
23.432
+0.771
3.4%
jan 1, 2007
24.232
+0.8
3.41%
jan 1, 2008
25.061
+0.829
3.42%
jan 1, 2009
25.925
+0.864
3.45%
jan 1, 2010
26.822
+0.897
3.46%
jan 1, 2011
21.407
-5.415
-20.19%
jan 1, 2012
21.658
+0.251
1.17%
jan 1, 2013
21.92
+0.262
1.21%
jan 1, 2014
22.191
+0.271
1.24%
jan 1, 2015
22.474
+0.282
1.27%
jan 1, 2016
22.778
+0.304
1.35%
Ranking of countries by current statistics by years


Comments: