29
/
en
AIzaSyAYiBZKx7MnpbEhh9jyipgxe19OcubqV5w
April 1, 2024
209684
New Zealand
NZL
true
2
1
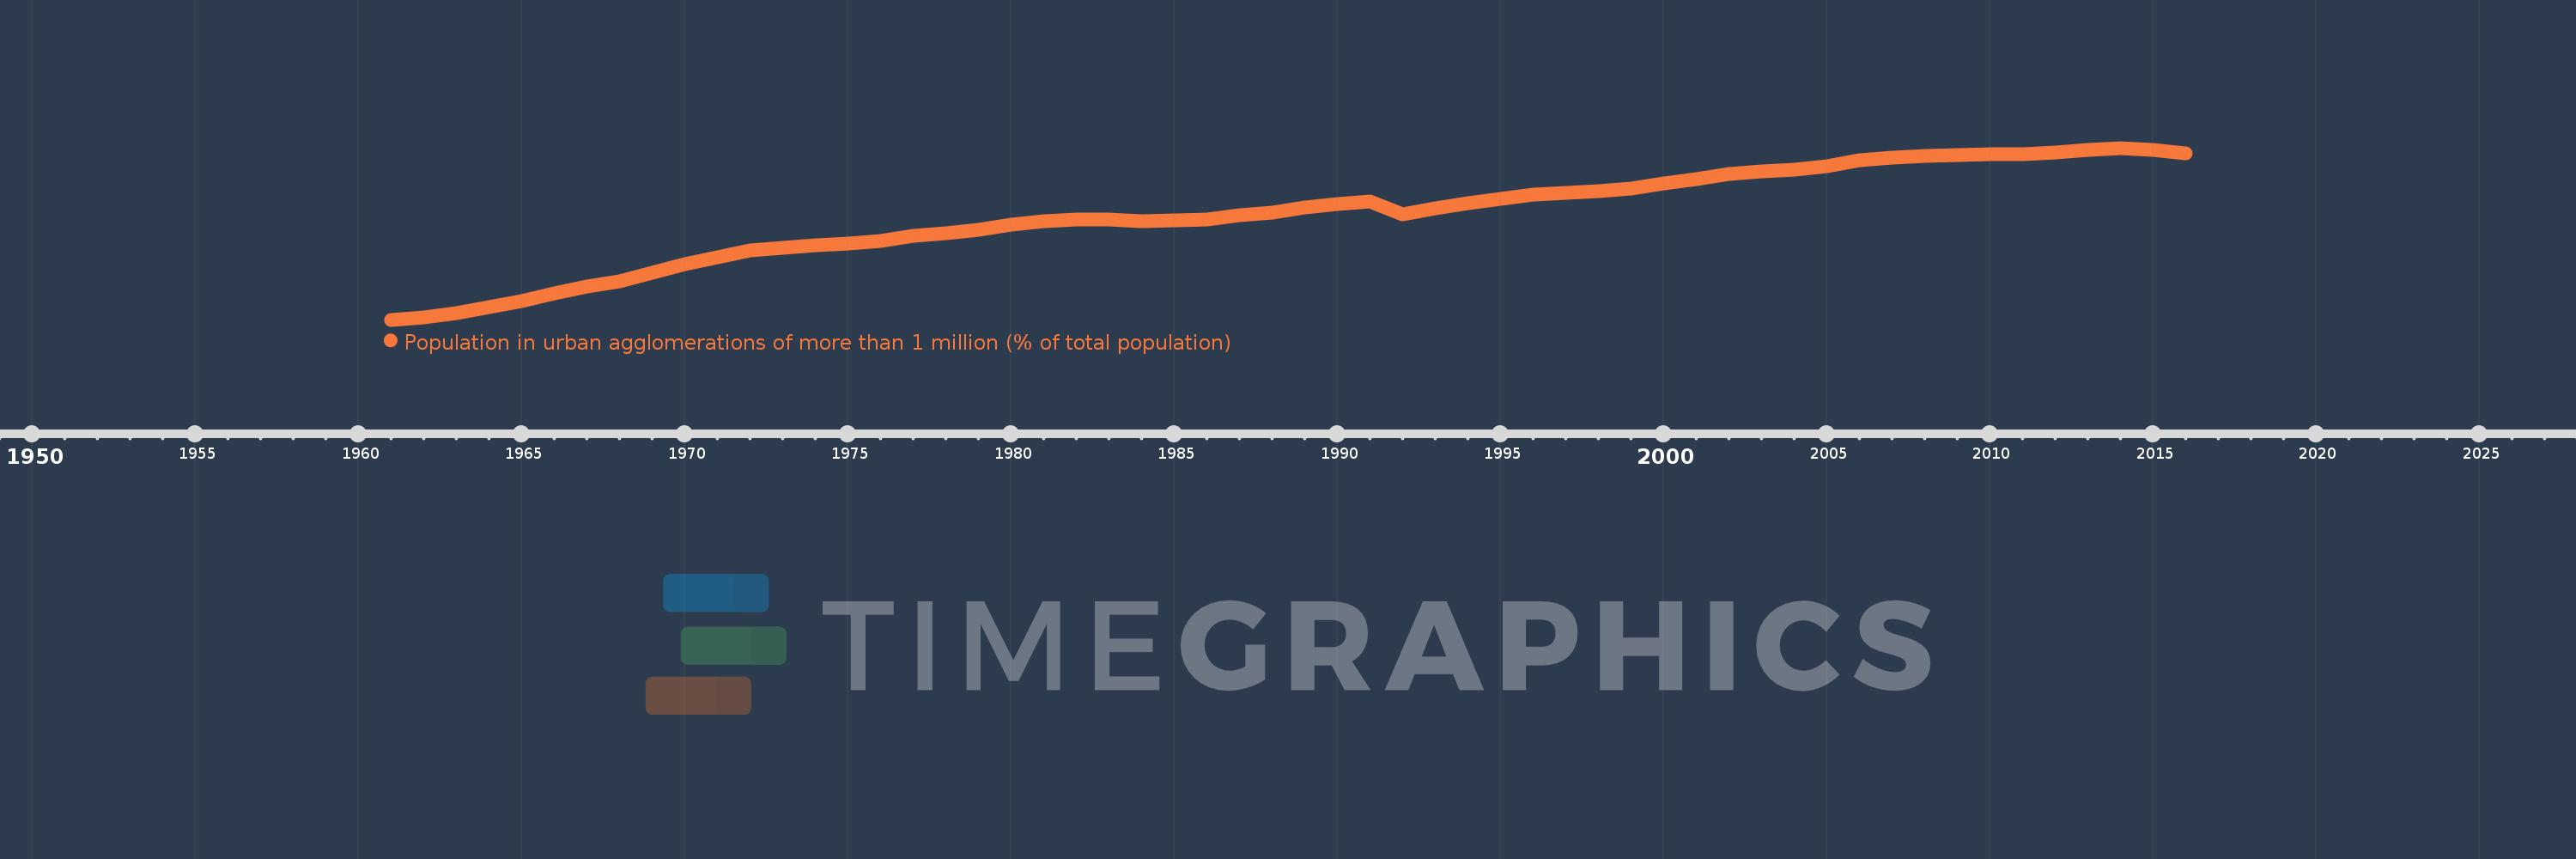
Population in urban agglomerations of more than 1 million (% of total population)
2016,2015,2014,2013,2012,2011,2010,2009,2008,2007,2006,2005,2004,2003,2002,2001,2000,1999,1998,1997,1996,1995,1994,1993,1992,1991,1990,1989,1988,1987,1986,1985,1984,1983,1982,1981,1980,1979,1978,1977,1976,1975,1974,1973,1972,1971,1970,1969,1968,1967,1966,1965,1964,1963,1962,1961
This statistics in other country:
Timeline:
This timeline shows a graph from 1961 to 2016 of New Zealand. No data until 1960. Number of actual observations by date: 56.
Source name:
World Development Indicators
Source organization:
United Nations, World Urbanization Prospects.
Categories, topics:
Climate Change, Urban Development
Last updated:
apr 23, 2017
Indicators value changes by year
Minimum:
18.558
jan 1, 1961
Maximum:
29.574
jan 1, 2014
At the date of observation
Value
Absolute change
Change from previous value
jan 1, 1961
18.558
+18.558
0.0%
jan 1, 1962
18.683
+0.125
0.67%
jan 1, 1963
18.971
+0.288
1.54%
jan 1, 1964
19.371
+0.399
2.11%
jan 1, 1965
19.758
+0.388
2.0%
jan 1, 1966
20.241
+0.483
2.44%
jan 1, 1967
20.672
+0.431
2.13%
jan 1, 1968
21.018
+0.346
1.67%
jan 1, 1969
21.566
+0.548
2.61%
jan 1, 1970
22.121
+0.556
2.58%
jan 1, 1971
22.588
+0.467
2.11%
jan 1, 1972
22.982
+0.394
1.74%
jan 1, 1973
23.184
+0.202
0.88%
jan 1, 1974
23.341
+0.158
0.68%
jan 1, 1975
23.471
+0.129
0.55%
jan 1, 1976
23.634
+0.163
0.7%
jan 1, 1977
23.942
+0.309
1.31%
jan 1, 1978
24.097
+0.155
0.65%
jan 1, 1979
24.321
+0.224
0.93%
jan 1, 1980
24.651
+0.33
1.36%
jan 1, 1981
24.857
+0.206
0.84%
jan 1, 1982
24.999
+0.142
0.57%
jan 1, 1983
24.99
-0.009
-0.04%
jan 1, 1984
24.89
-0.1
-0.4%
jan 1, 1985
24.913
+0.023
0.09%
jan 1, 1986
24.997
+0.084
0.34%
jan 1, 1987
25.284
+0.287
1.15%
jan 1, 1988
25.432
+0.148
0.59%
jan 1, 1989
25.732
+0.3
1.18%
jan 1, 1990
25.982
+0.249
0.97%
jan 1, 1991
26.118
+0.136
0.52%
jan 1, 1992
25.326
-0.792
-3.03%
jan 1, 1993
25.681
+0.355
1.4%
jan 1, 1994
26.014
+0.333
1.3%
jan 1, 1995
26.303
+0.288
1.11%
jan 1, 1996
26.558
+0.256
0.97%
jan 1, 1997
26.714
+0.156
0.59%
jan 1, 1998
26.791
+0.077
0.29%
jan 1, 1999
26.983
+0.192
0.72%
jan 1, 2000
27.274
+0.292
1.08%
jan 1, 2001
27.553
+0.278
1.02%
jan 1, 2002
27.899
+0.346
1.25%
jan 1, 2003
28.068
+0.169
0.61%
jan 1, 2004
28.172
+0.104
0.37%
jan 1, 2005
28.415
+0.243
0.86%
jan 1, 2006
28.761
+0.346
1.22%
jan 1, 2007
28.975
+0.214
0.75%
jan 1, 2008
29.037
+0.062
0.21%
jan 1, 2009
29.124
+0.087
0.3%
jan 1, 2010
29.165
+0.042
0.14%
jan 1, 2011
29.175
+0.01
0.03%
jan 1, 2012
29.287
+0.112
0.38%
jan 1, 2013
29.463
+0.176
0.6%
jan 1, 2014
29.574
+0.111
0.38%
jan 1, 2015
29.465
-0.108
-0.37%
jan 1, 2016
29.251
-0.214
-0.73%
Ranking of countries by current statistics by years


Comments: