29
/
en
AIzaSyAYiBZKx7MnpbEhh9jyipgxe19OcubqV5w
April 1, 2024
237614
Serbia
SRB
true
2
1
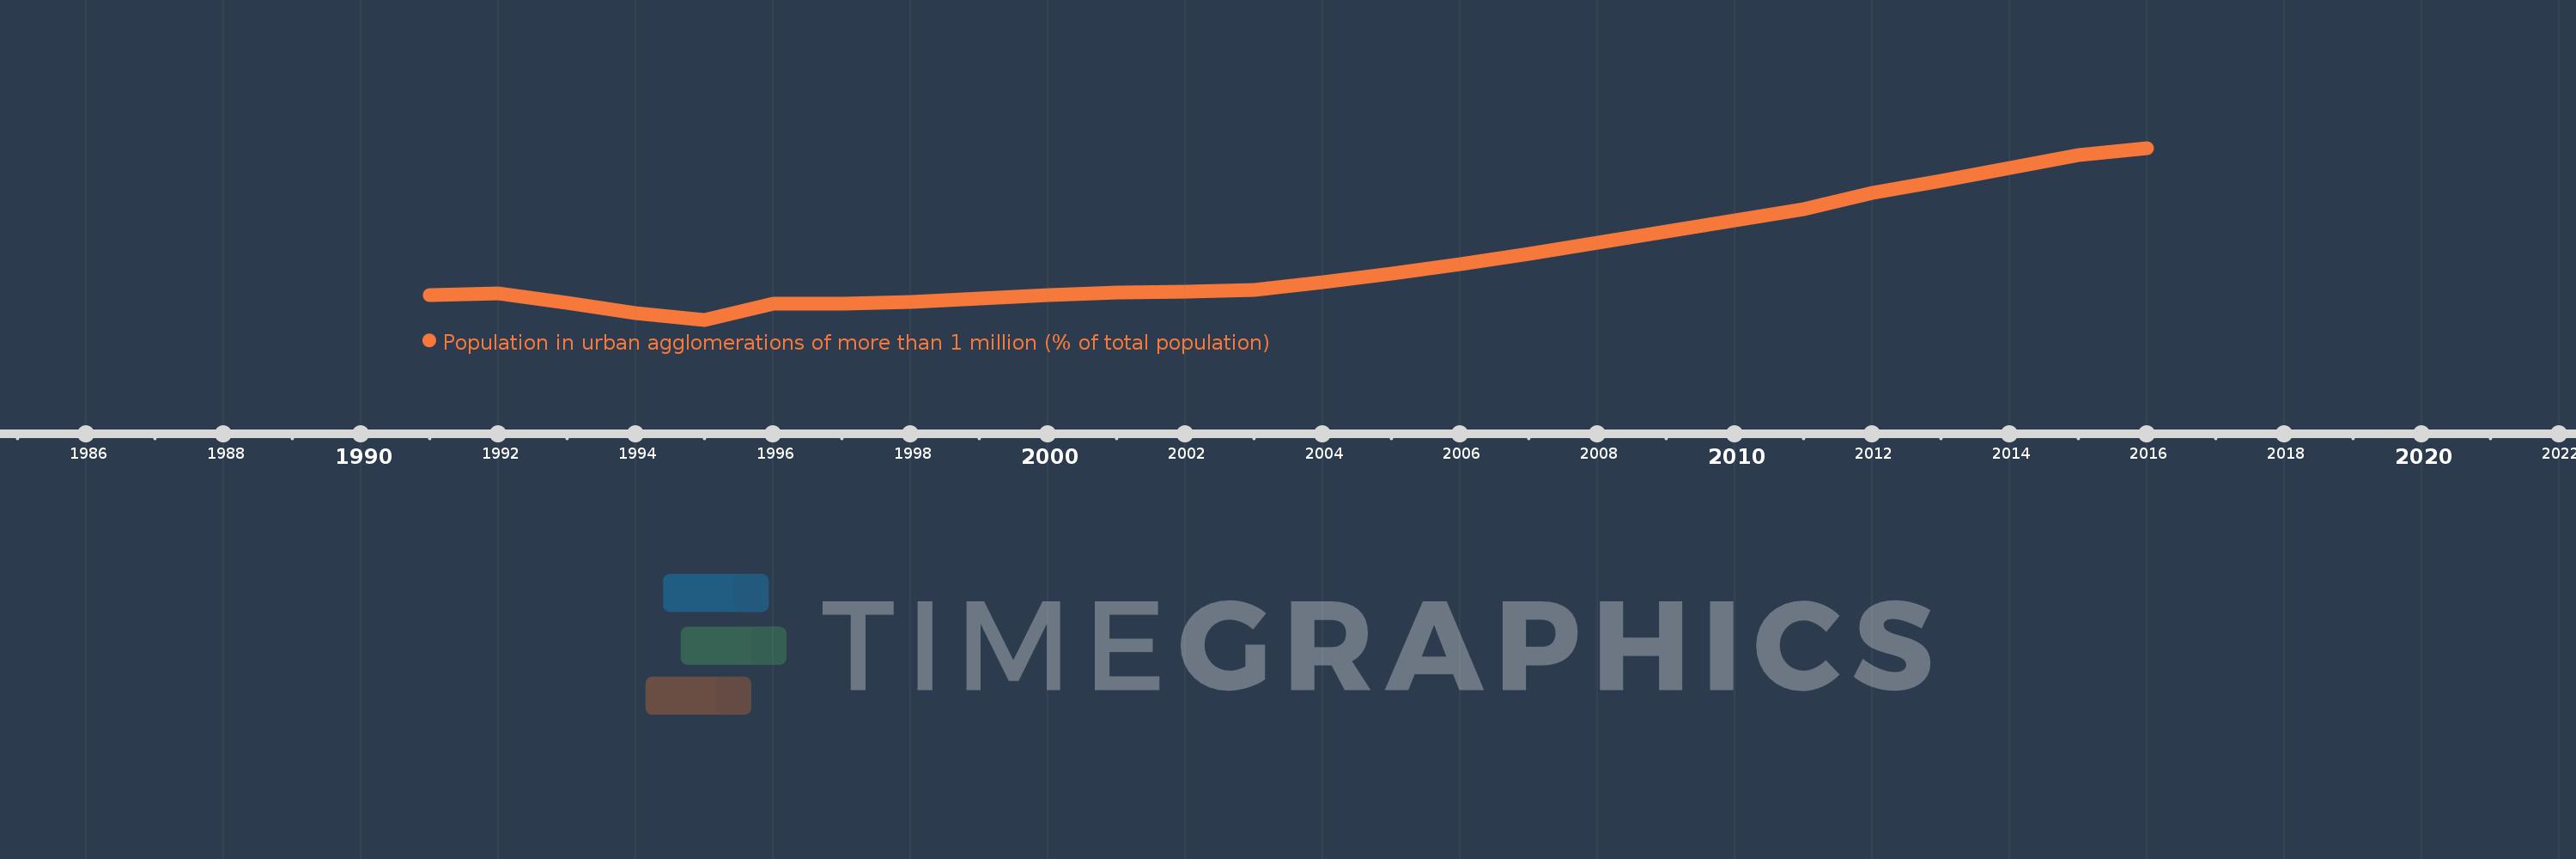
Population in urban agglomerations of more than 1 million (% of total population)
2016,2015,2014,2013,2012,2011,2010,2009,2008,2007,2006,2005,2004,2003,2002,2001,2000,1999,1998,1997,1996,1995,1994,1993,1992,1991
This statistics in other country:
Timeline:
This timeline shows a graph from 1991 to 2016 of Serbia. No data until 1990. Number of actual observations by date: 26.
Source name:
World Development Indicators
Source organization:
United Nations, World Urbanization Prospects.
Categories, topics:
Climate Change, Urban Development
Last updated:
apr 23, 2017
Indicators value changes by year
Minimum:
14.598
jan 1, 1995
Maximum:
16.649
jan 1, 2016
At the date of observation
Value
Absolute change
Change from previous value
jan 1, 1991
14.892
+14.892
0.0%
jan 1, 1992
14.914
+0.022
0.15%
jan 1, 1993
14.799
-0.115
-0.77%
jan 1, 1994
14.681
-0.118
-0.79%
jan 1, 1995
14.598
-0.083
-0.57%
jan 1, 1996
14.792
+0.193
1.32%
jan 1, 1997
14.79
-0.001
-0.01%
jan 1, 1998
14.815
+0.025
0.17%
jan 1, 1999
14.856
+0.04
0.27%
jan 1, 2000
14.893
+0.038
0.25%
jan 1, 2001
14.925
+0.031
0.21%
jan 1, 2002
14.934
+0.009
0.06%
jan 1, 2003
14.952
+0.018
0.12%
jan 1, 2004
15.049
+0.097
0.65%
jan 1, 2005
15.15
+0.101
0.67%
jan 1, 2006
15.261
+0.112
0.74%
jan 1, 2007
15.388
+0.127
0.83%
jan 1, 2008
15.518
+0.13
0.84%
jan 1, 2009
15.652
+0.134
0.86%
jan 1, 2010
15.783
+0.131
0.84%
jan 1, 2011
15.915
+0.133
0.84%
jan 1, 2012
16.111
+0.196
1.23%
jan 1, 2013
16.26
+0.149
0.92%
jan 1, 2014
16.411
+0.15
0.93%
jan 1, 2015
16.56
+0.149
0.91%
jan 1, 2016
16.649
+0.09
0.54%
Ranking of countries by current statistics by years


Comments: