29
/
en
AIzaSyAYiBZKx7MnpbEhh9jyipgxe19OcubqV5w
April 1, 2024
30213
Euro area
EMU
false
2
1
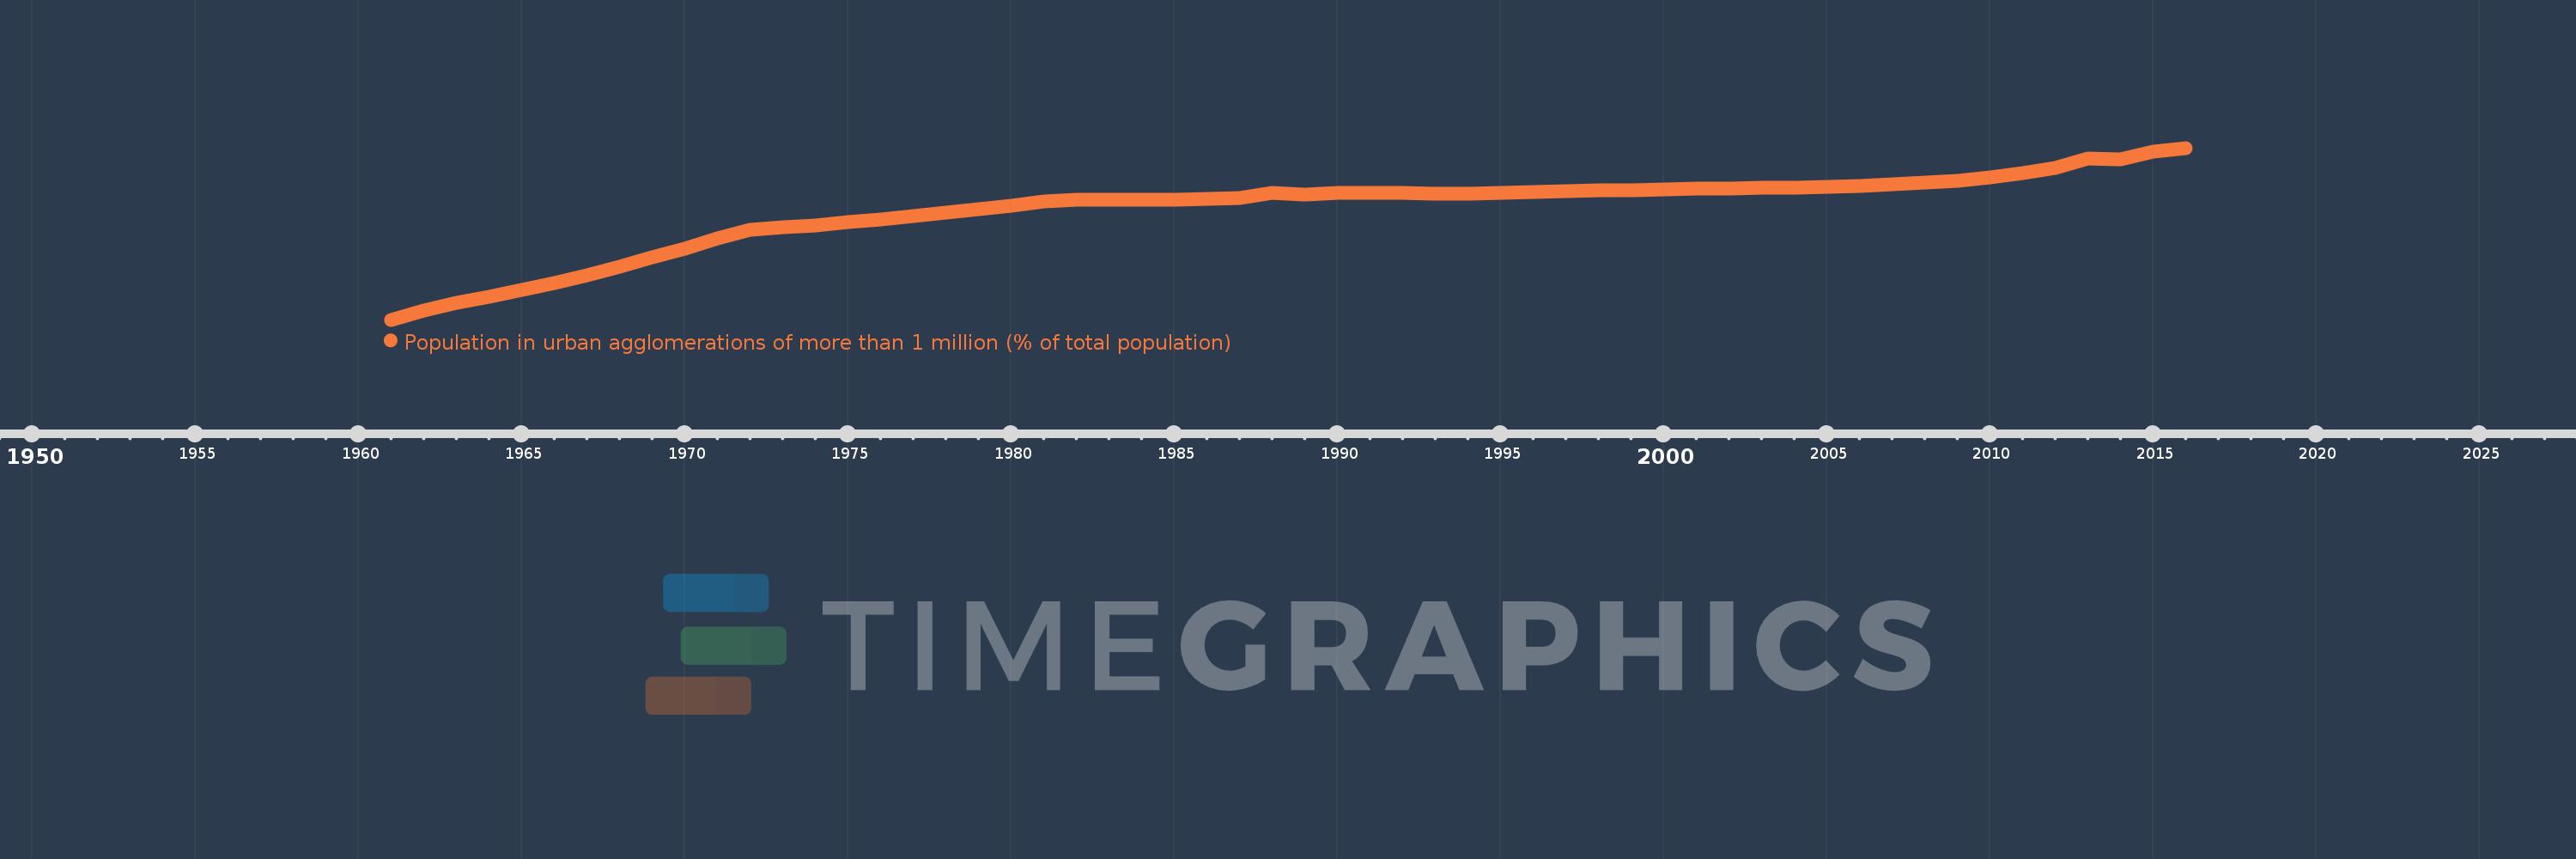
Population in urban agglomerations of more than 1 million (% of total population)
2016,2015,2014,2013,2012,2011,2010,2009,2008,2007,2006,2005,2004,2003,2002,2001,2000,1999,1998,1997,1996,1995,1994,1993,1992,1991,1990,1989,1988,1987,1986,1985,1984,1983,1982,1981,1980,1979,1978,1977,1976,1975,1974,1973,1972,1971,1970,1969,1968,1967,1966,1965,1964,1963,1962,1961
This statistics in other country:
Timeline:
This timeline shows a graph from 1961 to 2016 of Euro area. No data until 1960. Number of actual observations by date: 56.
Source name:
World Development Indicators
Source organization:
United Nations, World Urbanization Prospects.
Categories, topics:
Climate Change, Urban Development
Last updated:
apr 23, 2017
Indicators value changes by year
Minimum:
15.481
jan 1, 1961
At the date of observation
Value
Absolute change
Change from previous value
jan 1, 1961
15.481
+15.481
0.0%
jan 1, 1962
15.645
+0.164
1.06%
jan 1, 1963
15.775
+0.13
0.83%
jan 1, 1964
15.881
+0.106
0.67%
jan 1, 1965
15.995
+0.114
0.72%
jan 1, 1966
16.111
+0.117
0.73%
jan 1, 1967
16.24
+0.129
0.8%
jan 1, 1968
16.391
+0.151
0.93%
jan 1, 1969
16.55
+0.159
0.97%
jan 1, 1970
16.701
+0.152
0.92%
jan 1, 1971
16.879
+0.178
1.07%
jan 1, 1972
17.025
+0.145
0.86%
jan 1, 1973
17.074
+0.049
0.29%
jan 1, 1974
17.111
+0.037
0.21%
jan 1, 1975
17.16
+0.049
0.29%
jan 1, 1976
17.21
+0.051
0.3%
jan 1, 1977
17.262
+0.051
0.3%
jan 1, 1978
17.322
+0.061
0.35%
jan 1, 1979
17.379
+0.057
0.33%
jan 1, 1980
17.445
+0.066
0.38%
jan 1, 1981
17.511
+0.066
0.38%
jan 1, 1982
17.555
+0.044
0.25%
jan 1, 1983
17.551
-0.005
-0.03%
jan 1, 1984
17.548
-0.002
-0.01%
jan 1, 1985
17.551
+0.002
0.01%
jan 1, 1986
17.561
+0.01
0.06%
jan 1, 1987
17.58
+0.02
0.11%
jan 1, 1988
17.666
+0.086
0.49%
jan 1, 1989
17.644
-0.022
-0.12%
jan 1, 1990
17.666
+0.022
0.12%
jan 1, 1991
17.661
-0.005
-0.03%
jan 1, 1992
17.661
-0.001
0.0%
jan 1, 1993
17.655
-0.006
-0.03%
jan 1, 1994
17.658
+0.003
0.02%
jan 1, 1995
17.671
+0.013
0.07%
jan 1, 1996
17.684
+0.013
0.08%
jan 1, 1997
17.698
+0.013
0.08%
jan 1, 1998
17.708
+0.011
0.06%
jan 1, 1999
17.718
+0.009
0.05%
jan 1, 2000
17.729
+0.012
0.06%
jan 1, 2001
17.742
+0.012
0.07%
jan 1, 2002
17.743
+0.002
0.01%
jan 1, 2003
17.749
+0.006
0.03%
jan 1, 2004
17.757
+0.008
0.04%
jan 1, 2005
17.763
+0.005
0.03%
jan 1, 2006
17.779
+0.016
0.09%
jan 1, 2007
17.814
+0.035
0.2%
jan 1, 2008
17.841
+0.027
0.15%
jan 1, 2009
17.872
+0.031
0.17%
jan 1, 2010
17.935
+0.062
0.35%
jan 1, 2011
18.011
+0.077
0.43%
jan 1, 2012
18.089
+0.077
0.43%
jan 1, 2013
18.259
+0.17
0.94%
jan 1, 2014
18.239
-0.02
-0.11%
jan 1, 2015
18.375
+0.136
0.75%
jan 1, 2016
18.44
+0.065
0.35%
Ranking of countries by current statistics by years


Comments: