29
/
en
AIzaSyAYiBZKx7MnpbEhh9jyipgxe19OcubqV5w
April 1, 2024
44581
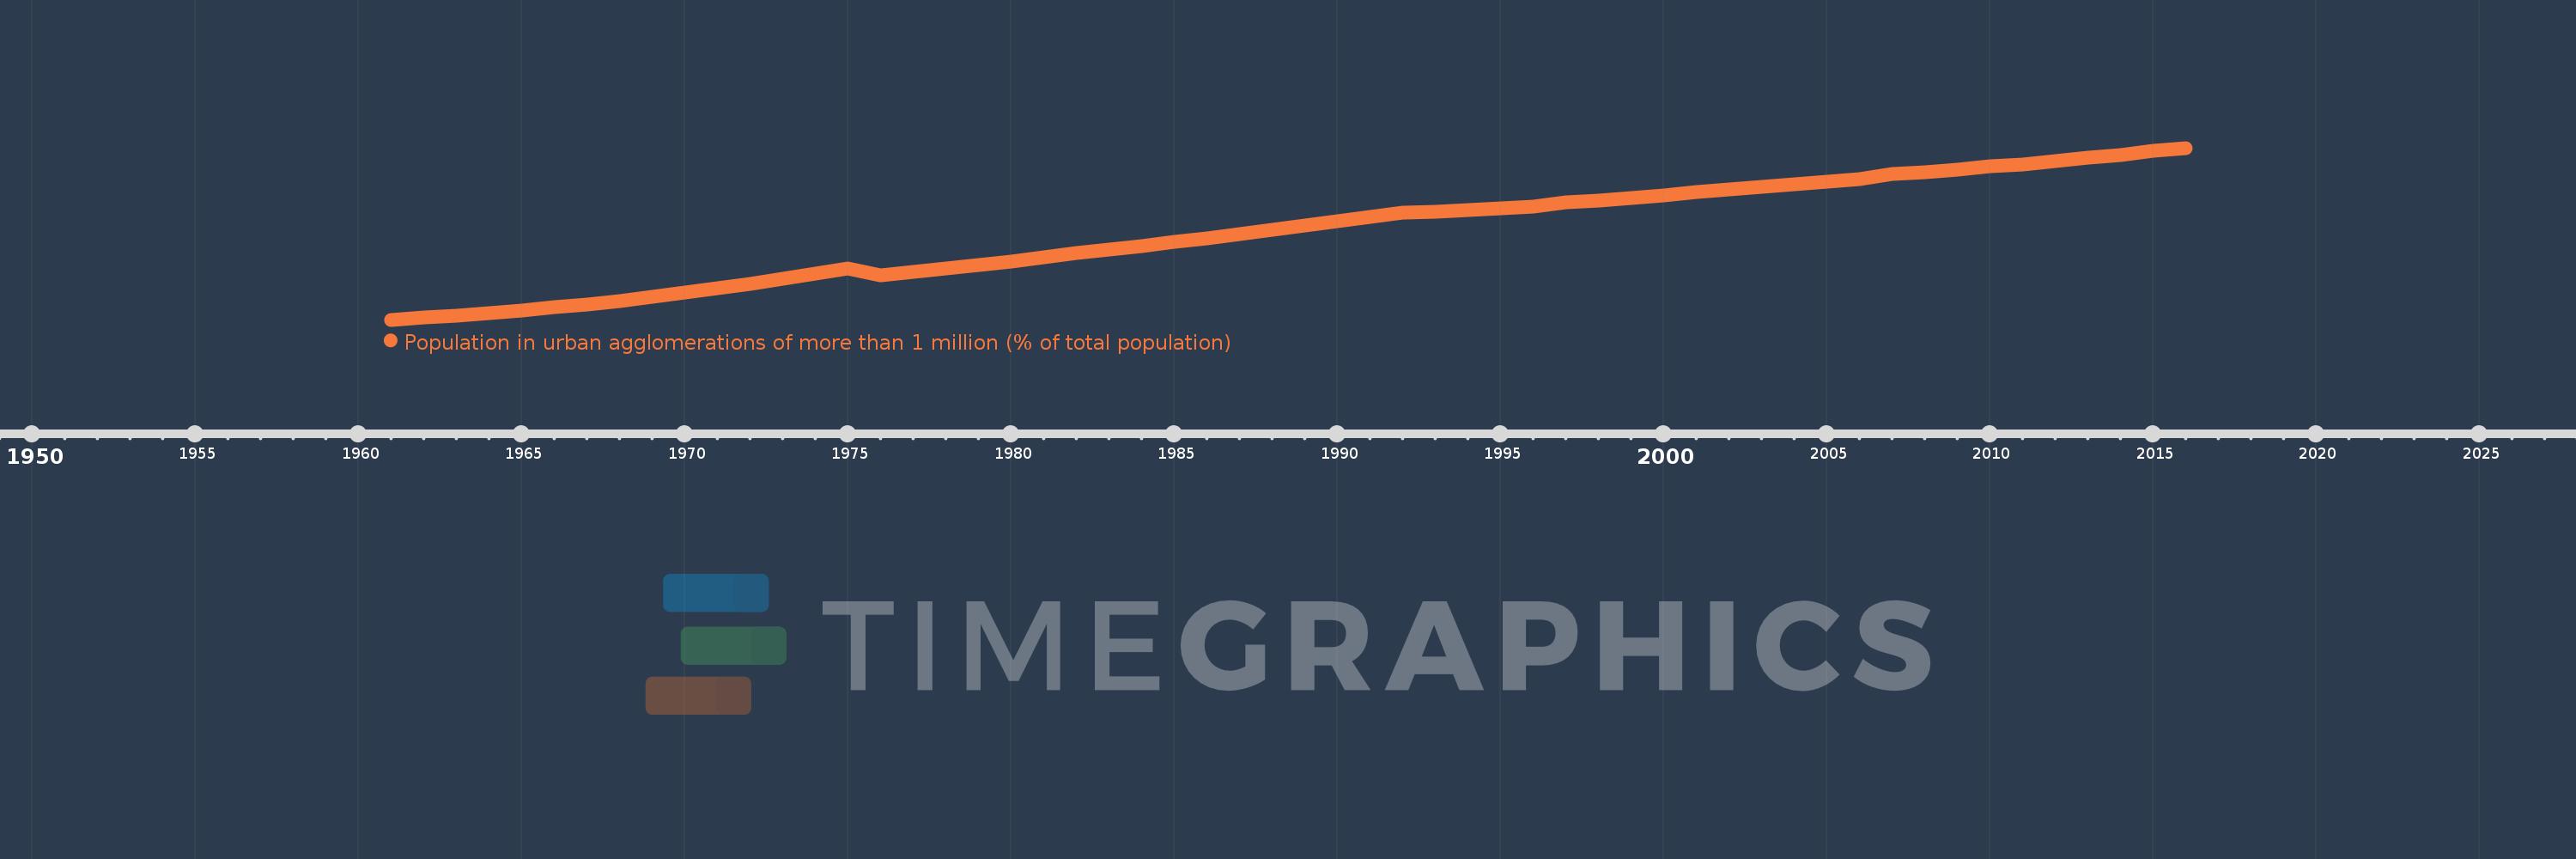
Least developed countries: UN classification
LDC
false
2
1
Population in urban agglomerations of more than 1 million (% of total population)
2016,2015,2014,2013,2012,2011,2010,2009,2008,2007,2006,2005,2004,2003,2002,2001,2000,1999,1998,1997,1996,1995,1994,1993,1992,1991,1990,1989,1988,1987,1986,1985,1984,1983,1982,1981,1980,1979,1978,1977,1976,1975,1974,1973,1972,1971,1970,1969,1968,1967,1966,1965,1964,1963,1962,1961
This statistics in other country:
Timeline:
This timeline shows a graph from 1961 to 2016 of Least developed countries: UN classification. No data until 1960. Number of actual observations by date: 56.
Source name:
World Development Indicators
Source organization:
United Nations, World Urbanization Prospects.
Categories, topics:
Climate Change, Urban Development
Last updated:
apr 23, 2017
Indicators value changes by year
Maximum:
12.499
jan 1, 2016
At the date of observation
Value
Absolute change
Change from previous value
jan 1, 1961
3.655
+3.655
0.0%
jan 1, 1962
3.757
+0.102
2.79%
jan 1, 1963
3.878
+0.121
3.23%
jan 1, 1964
4.005
+0.127
3.27%
jan 1, 1965
4.141
+0.136
3.4%
jan 1, 1966
4.284
+0.143
3.45%
jan 1, 1967
4.434
+0.15
3.5%
jan 1, 1968
4.62
+0.186
4.2%
jan 1, 1969
4.821
+0.201
4.35%
jan 1, 1970
5.039
+0.218
4.52%
jan 1, 1971
5.266
+0.227
4.51%
jan 1, 1972
5.503
+0.237
4.51%
jan 1, 1973
5.763
+0.259
4.71%
jan 1, 1974
6.038
+0.275
4.78%
jan 1, 1975
6.316
+0.278
4.6%
jan 1, 1976
5.942
-0.374
-5.91%
jan 1, 1977
6.123
+0.181
3.04%
jan 1, 1978
6.303
+0.18
2.94%
jan 1, 1979
6.485
+0.182
2.89%
jan 1, 1980
6.661
+0.176
2.71%
jan 1, 1981
6.874
+0.213
3.2%
jan 1, 1982
7.083
+0.209
3.04%
jan 1, 1983
7.255
+0.172
2.42%
jan 1, 1984
7.443
+0.189
2.6%
jan 1, 1985
7.649
+0.205
2.75%
jan 1, 1986
7.853
+0.204
2.67%
jan 1, 1987
8.066
+0.213
2.71%
jan 1, 1988
8.281
+0.216
2.67%
jan 1, 1989
8.503
+0.222
2.68%
jan 1, 1990
8.723
+0.22
2.59%
jan 1, 1991
8.946
+0.222
2.55%
jan 1, 1992
9.151
+0.205
2.29%
jan 1, 1993
9.226
+0.076
0.83%
jan 1, 1994
9.31
+0.083
0.9%
jan 1, 1995
9.393
+0.083
0.89%
jan 1, 1996
9.486
+0.093
1.0%
jan 1, 1997
9.68
+0.194
2.05%
jan 1, 1998
9.81
+0.13
1.34%
jan 1, 1999
9.942
+0.132
1.34%
jan 1, 2000
10.067
+0.125
1.26%
jan 1, 2001
10.222
+0.155
1.54%
jan 1, 2002
10.367
+0.144
1.41%
jan 1, 2003
10.501
+0.134
1.29%
jan 1, 2004
10.636
+0.136
1.29%
jan 1, 2005
10.78
+0.144
1.36%
jan 1, 2006
10.905
+0.124
1.15%
jan 1, 2007
11.161
+0.257
2.35%
jan 1, 2008
11.245
+0.083
0.75%
jan 1, 2009
11.395
+0.15
1.34%
jan 1, 2010
11.561
+0.166
1.46%
jan 1, 2011
11.648
+0.087
0.75%
jan 1, 2012
11.813
+0.164
1.41%
jan 1, 2013
11.981
+0.168
1.42%
jan 1, 2014
12.153
+0.172
1.44%
jan 1, 2015
12.331
+0.178
1.47%
jan 1, 2016
12.499
+0.168
1.36%
Ranking of countries by current statistics by years


Comments: