29
/
en
AIzaSyAYiBZKx7MnpbEhh9jyipgxe19OcubqV5w
April 1, 2024
119295
Denmark
DNK
true
2
1
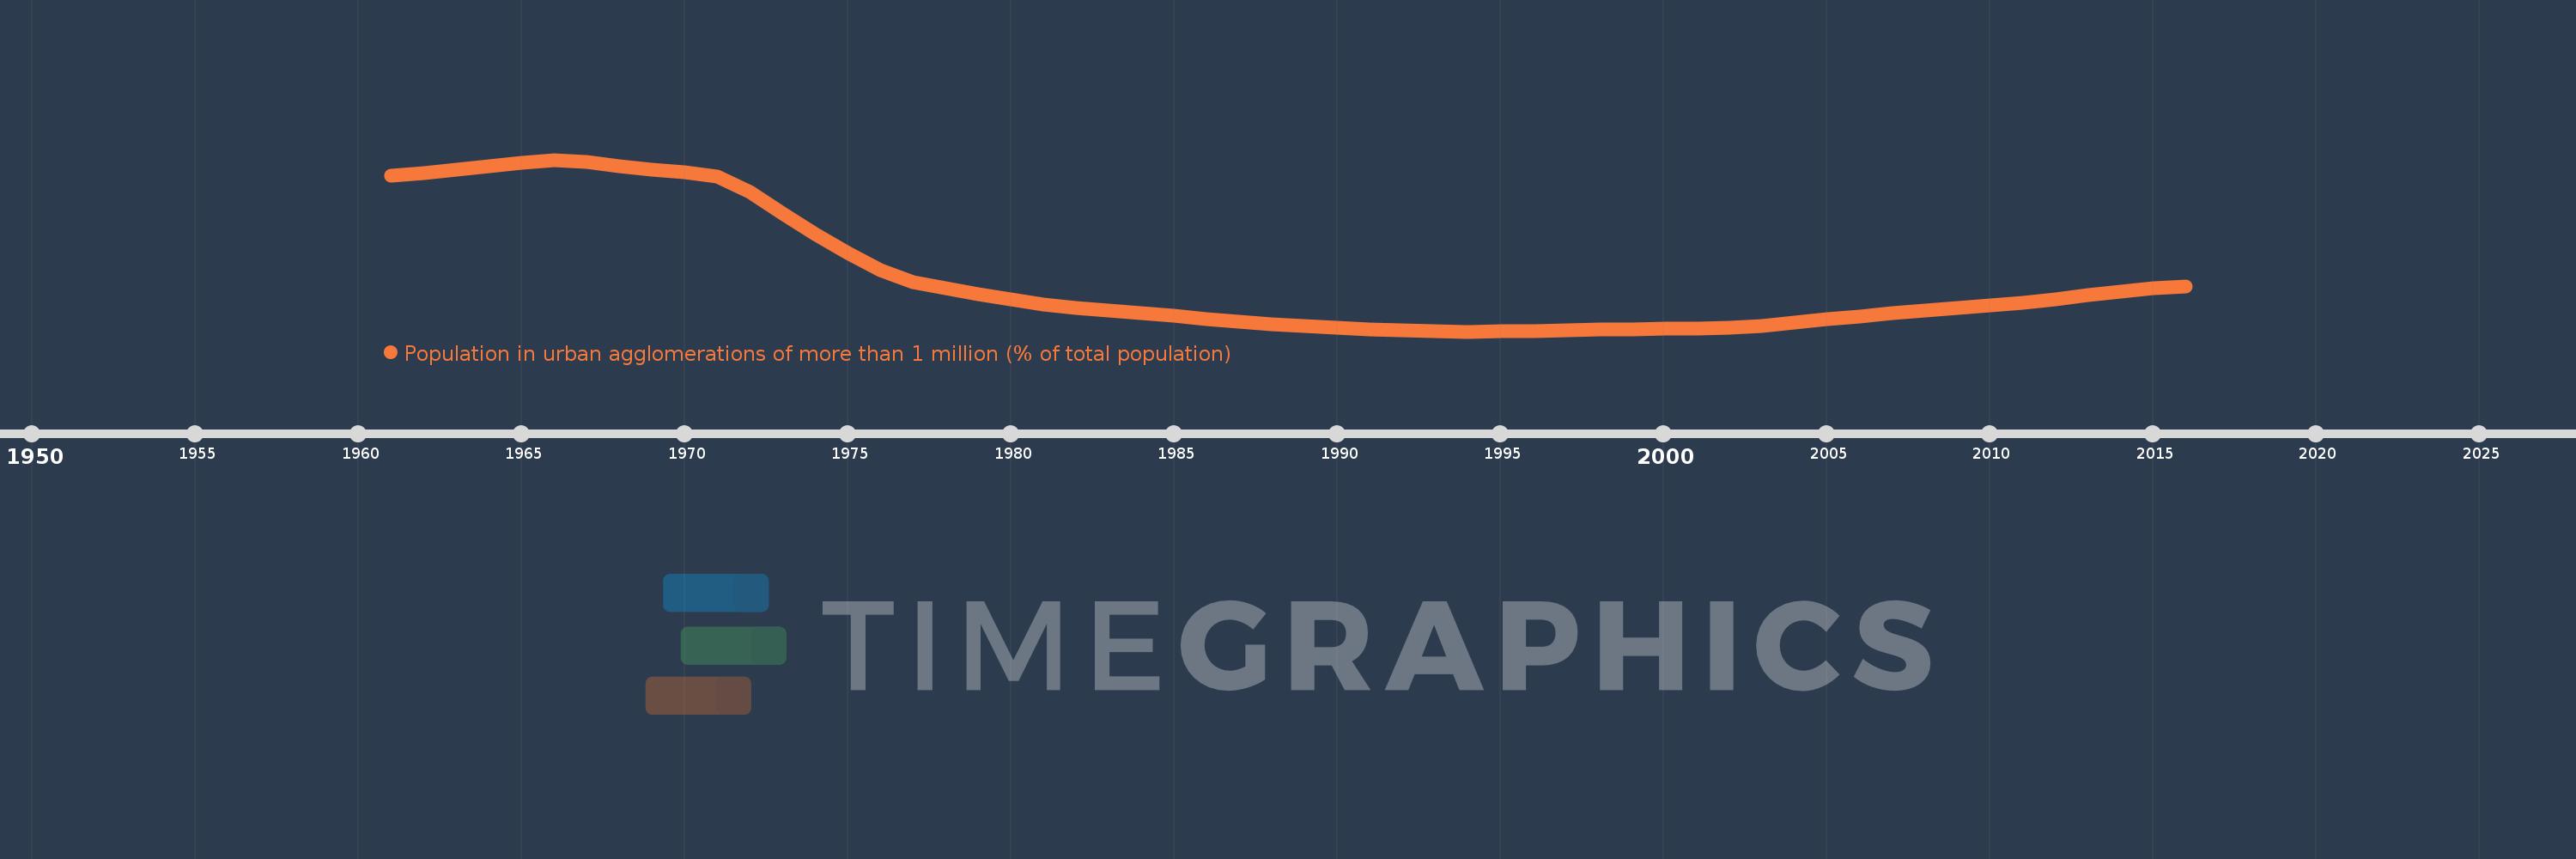
Population in urban agglomerations of more than 1 million (% of total population)
2016,2015,2014,2013,2012,2011,2010,2009,2008,2007,2006,2005,2004,2003,2002,2001,2000,1999,1998,1997,1996,1995,1994,1993,1992,1991,1990,1989,1988,1987,1986,1985,1984,1983,1982,1981,1980,1979,1978,1977,1976,1975,1974,1973,1972,1971,1970,1969,1968,1967,1966,1965,1964,1963,1962,1961
This statistics in other country:
Timeline:
This timeline shows a graph from 1961 to 2016 of Denmark. No data until 1960. Number of actual observations by date: 56.
Source name:
World Development Indicators
Source organization:
United Nations, World Urbanization Prospects.
Categories, topics:
Climate Change, Urban Development
Last updated:
apr 23, 2017
Indicators value changes by year
Minimum:
20.006
jan 1, 1994
Maximum:
28.852
jan 1, 1966
At the date of observation
Value
Absolute change
Change from previous value
jan 1, 1961
28.046
+28.046
0.0%
jan 1, 1962
28.188
+0.142
0.5%
jan 1, 1963
28.355
+0.167
0.59%
jan 1, 1964
28.52
+0.165
0.58%
jan 1, 1965
28.683
+0.163
0.57%
jan 1, 1966
28.852
+0.169
0.59%
jan 1, 1967
28.724
-0.128
-0.44%
jan 1, 1968
28.509
-0.215
-0.75%
jan 1, 1969
28.346
-0.163
-0.57%
jan 1, 1970
28.2
-0.146
-0.51%
jan 1, 1971
27.999
-0.201
-0.71%
jan 1, 1972
27.187
-0.812
-2.9%
jan 1, 1973
26.093
-1.094
-4.02%
jan 1, 1974
25.038
-1.055
-4.04%
jan 1, 1975
24.057
-0.981
-3.92%
jan 1, 1976
23.156
-0.901
-3.75%
jan 1, 1977
22.568
-0.588
-2.54%
jan 1, 1978
22.256
-0.313
-1.39%
jan 1, 1979
21.947
-0.309
-1.39%
jan 1, 1980
21.656
-0.29
-1.32%
jan 1, 1981
21.396
-0.26
-1.2%
jan 1, 1982
21.212
-0.184
-0.86%
jan 1, 1983
21.08
-0.132
-0.62%
jan 1, 1984
20.948
-0.132
-0.63%
jan 1, 1985
20.813
-0.135
-0.64%
jan 1, 1986
20.66
-0.153
-0.73%
jan 1, 1987
20.511
-0.149
-0.72%
jan 1, 1988
20.386
-0.125
-0.61%
jan 1, 1989
20.277
-0.108
-0.53%
jan 1, 1990
20.194
-0.083
-0.41%
jan 1, 1991
20.138
-0.056
-0.28%
jan 1, 1992
20.082
-0.056
-0.28%
jan 1, 1993
20.034
-0.049
-0.24%
jan 1, 1994
20.006
-0.028
-0.14%
jan 1, 1995
20.017
+0.011
0.06%
jan 1, 1996
20.032
+0.015
0.08%
jan 1, 1997
20.057
+0.025
0.13%
jan 1, 1998
20.101
+0.044
0.22%
jan 1, 1999
20.122
+0.021
0.11%
jan 1, 2000
20.148
+0.025
0.13%
jan 1, 2001
20.172
+0.025
0.12%
jan 1, 2002
20.192
+0.02
0.1%
jan 1, 2003
20.285
+0.092
0.46%
jan 1, 2004
20.453
+0.168
0.83%
jan 1, 2005
20.626
+0.173
0.85%
jan 1, 2006
20.796
+0.17
0.83%
jan 1, 2007
20.957
+0.161
0.77%
jan 1, 2008
21.099
+0.142
0.68%
jan 1, 2009
21.216
+0.117
0.55%
jan 1, 2010
21.344
+0.128
0.6%
jan 1, 2011
21.493
+0.149
0.7%
jan 1, 2012
21.667
+0.174
0.81%
jan 1, 2013
21.867
+0.201
0.93%
jan 1, 2014
22.06
+0.193
0.88%
jan 1, 2015
22.235
+0.174
0.79%
jan 1, 2016
22.341
+0.106
0.48%
Ranking of countries by current statistics by years


Comments: