29
/
en
AIzaSyAYiBZKx7MnpbEhh9jyipgxe19OcubqV5w
April 1, 2024
275141
United Arab Emirates
ARE
true
2
1
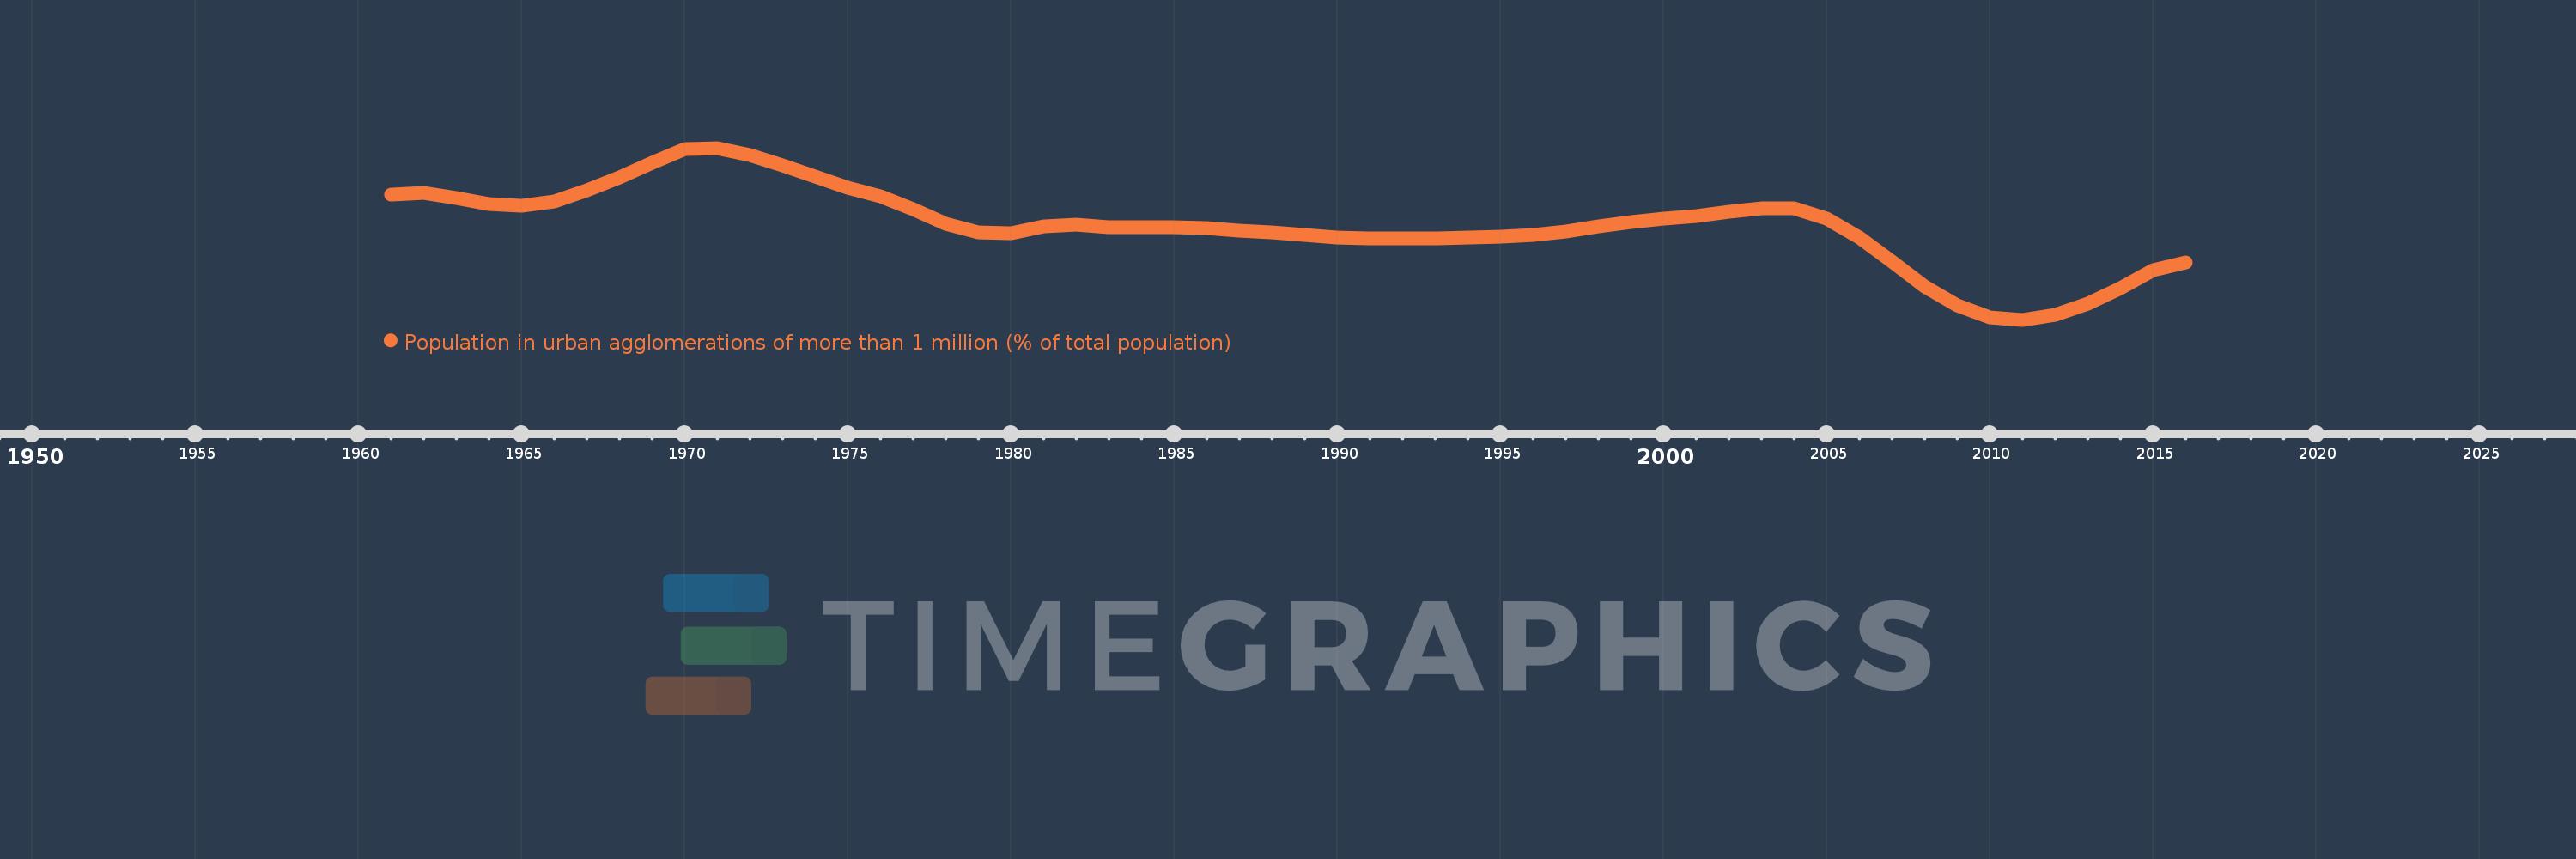
Population in urban agglomerations of more than 1 million (% of total population)
2016,2015,2014,2013,2012,2011,2010,2009,2008,2007,2006,2005,2004,2003,2002,2001,2000,1999,1998,1997,1996,1995,1994,1993,1992,1991,1990,1989,1988,1987,1986,1985,1984,1983,1982,1981,1980,1979,1978,1977,1976,1975,1974,1973,1972,1971,1970,1969,1968,1967,1966,1965,1964,1963,1962,1961
This statistics in other country:
Timeline:
This timeline shows a graph from 1961 to 2016 of United Arab Emirates. No data until 1960. Number of actual observations by date: 56.
Source name:
World Development Indicators
Source organization:
United Nations, World Urbanization Prospects.
Categories, topics:
Climate Change, Urban Development
Last updated:
apr 23, 2017
Indicators value changes by year
Maximum:
72.574
jan 1, 1971
At the date of observation
Value
Absolute change
Change from previous value
jan 1, 1961
64.514
+64.514
0.0%
jan 1, 1962
64.754
+0.24
0.37%
jan 1, 1963
63.864
-0.89
-1.37%
jan 1, 1964
62.842
-1.022
-1.6%
jan 1, 1965
62.594
-0.247
-0.39%
jan 1, 1966
63.359
+0.765
1.22%
jan 1, 1967
65.193
+1.834
2.89%
jan 1, 1968
67.501
+2.308
3.54%
jan 1, 1969
69.963
+2.462
3.65%
jan 1, 1970
72.393
+2.43
3.47%
jan 1, 1971
72.574
+0.181
0.25%
jan 1, 1972
71.3
-1.274
-1.76%
jan 1, 1973
69.529
-1.771
-2.48%
jan 1, 1974
67.577
-1.952
-2.81%
jan 1, 1975
65.736
-1.84
-2.72%
jan 1, 1976
64.226
-1.511
-2.3%
jan 1, 1977
62.061
-2.164
-3.37%
jan 1, 1978
59.539
-2.522
-4.06%
jan 1, 1979
58.056
-1.484
-2.49%
jan 1, 1980
57.873
-0.183
-0.31%
jan 1, 1981
59.035
+1.162
2.01%
jan 1, 1982
59.378
+0.344
0.58%
jan 1, 1983
58.877
-0.501
-0.84%
jan 1, 1984
58.85
-0.027
-0.05%
jan 1, 1985
58.876
+0.026
0.04%
jan 1, 1986
58.692
-0.184
-0.31%
jan 1, 1987
58.346
-0.346
-0.59%
jan 1, 1988
57.939
-0.408
-0.7%
jan 1, 1989
57.513
-0.426
-0.73%
jan 1, 1990
57.18
-0.333
-0.58%
jan 1, 1991
57.016
-0.164
-0.29%
jan 1, 1992
56.963
-0.053
-0.09%
jan 1, 1993
56.97
+0.007
0.01%
jan 1, 1994
57.054
+0.084
0.15%
jan 1, 1995
57.263
+0.208
0.37%
jan 1, 1996
57.585
+0.323
0.56%
jan 1, 1997
58.217
+0.632
1.1%
jan 1, 1998
59.014
+0.797
1.37%
jan 1, 1999
59.733
+0.719
1.22%
jan 1, 2000
60.371
+0.638
1.07%
jan 1, 2001
60.88
+0.509
0.84%
jan 1, 2002
61.534
+0.654
1.07%
jan 1, 2003
62.218
+0.684
1.11%
jan 1, 2004
62.117
-0.101
-0.16%
jan 1, 2005
60.425
-1.692
-2.72%
jan 1, 2006
57.171
-3.253
-5.38%
jan 1, 2007
52.923
-4.248
-7.43%
jan 1, 2008
48.683
-4.24
-8.01%
jan 1, 2009
45.339
-3.344
-6.87%
jan 1, 2010
43.404
-1.935
-4.27%
jan 1, 2011
42.93
-0.474
-1.09%
jan 1, 2012
43.771
+0.841
1.96%
jan 1, 2013
45.667
+1.895
4.33%
jan 1, 2014
48.352
+2.686
5.88%
jan 1, 2015
51.434
+3.082
6.37%
jan 1, 2016
52.844
+1.41
2.74%
Ranking of countries by current statistics by years


Comments: