29
/
en
AIzaSyAYiBZKx7MnpbEhh9jyipgxe19OcubqV5w
April 1, 2024
188297
Malaysia
MYS
true
2
1
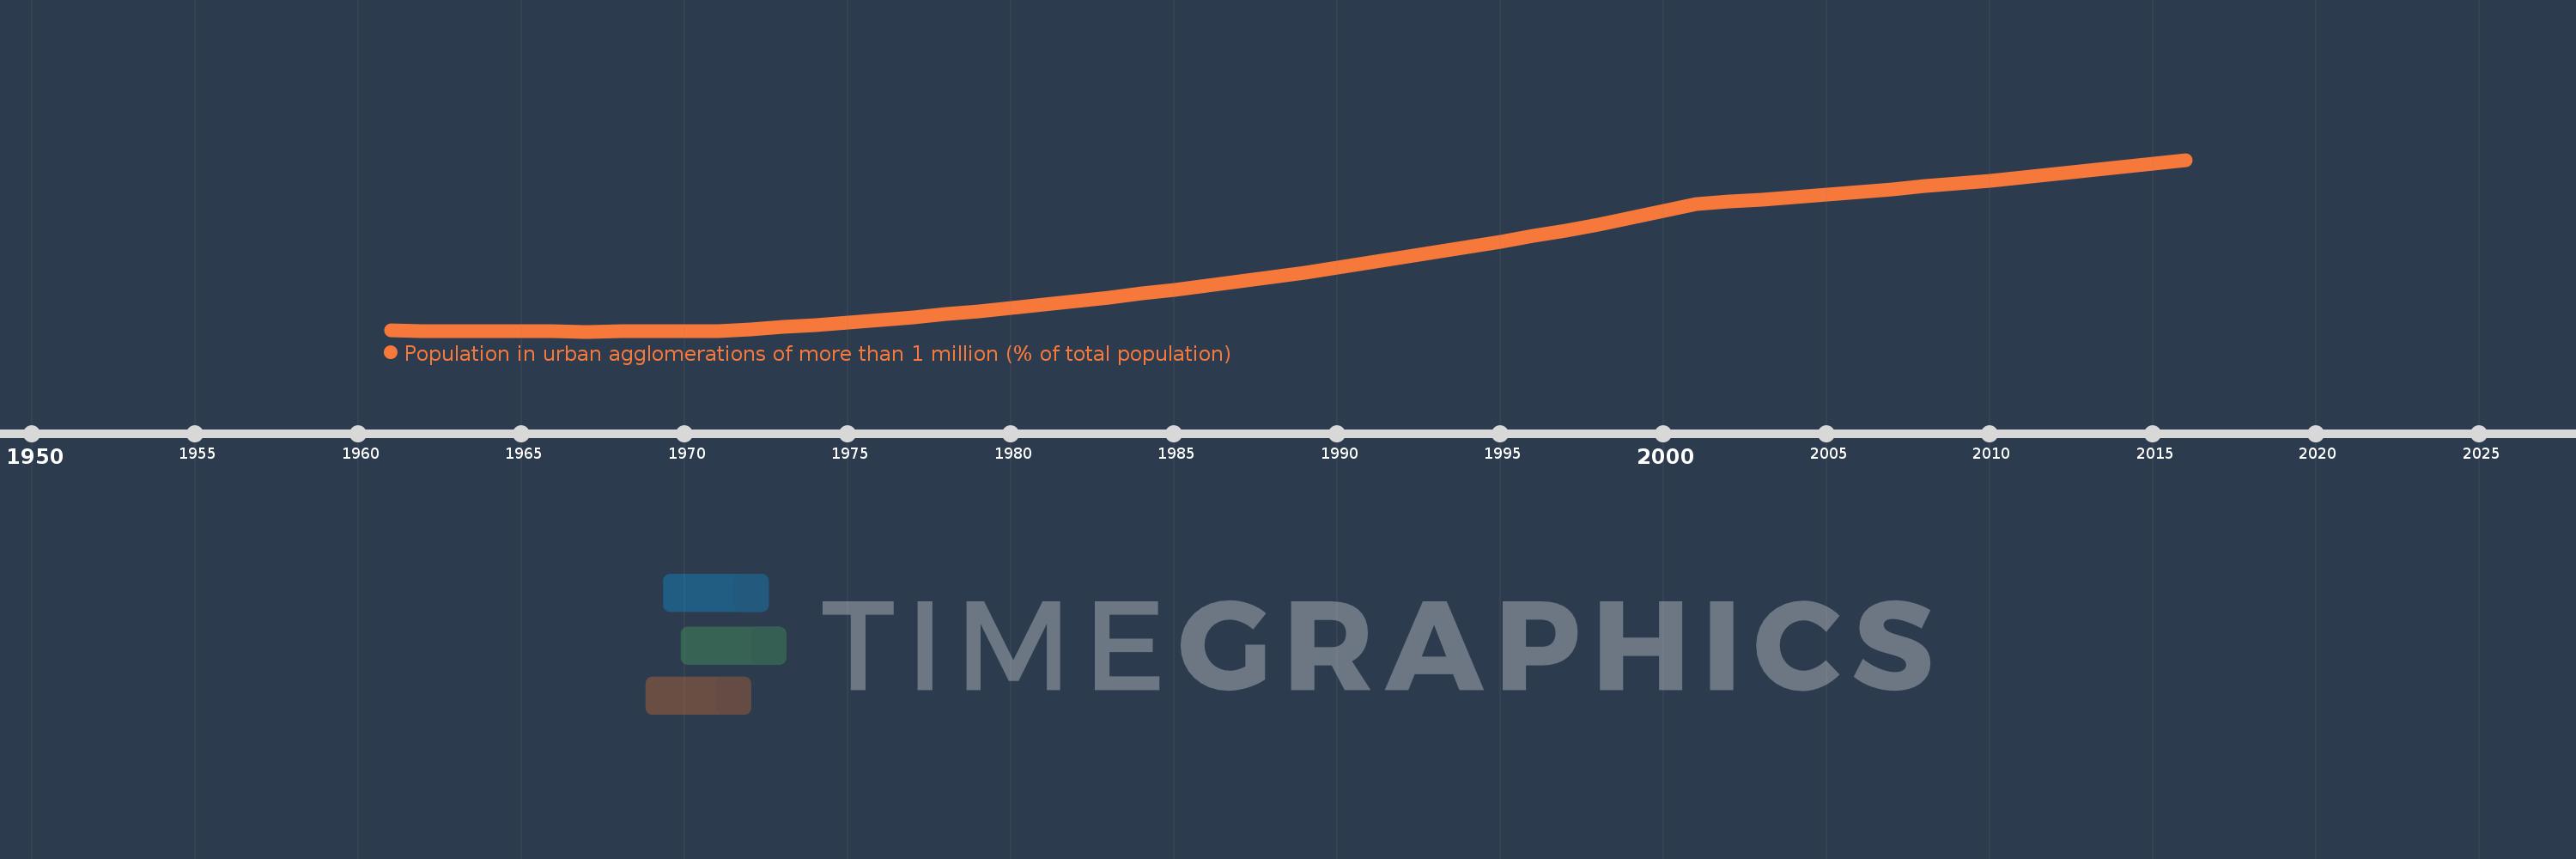
Population in urban agglomerations of more than 1 million (% of total population)
2016,2015,2014,2013,2012,2011,2010,2009,2008,2007,2006,2005,2004,2003,2002,2001,2000,1999,1998,1997,1996,1995,1994,1993,1992,1991,1990,1989,1988,1987,1986,1985,1984,1983,1982,1981,1980,1979,1978,1977,1976,1975,1974,1973,1972,1971,1970,1969,1968,1967,1966,1965,1964,1963,1962,1961
This statistics in other country:
Timeline:
This timeline shows a graph from 1961 to 2016 of Malaysia. No data until 1960. Number of actual observations by date: 56.
Source name:
World Development Indicators
Source organization:
United Nations, World Urbanization Prospects.
Categories, topics:
Climate Change, Urban Development
Last updated:
apr 23, 2017
Indicators value changes by year
Maximum:
22.541
jan 1, 2016
At the date of observation
Value
Absolute change
Change from previous value
jan 1, 1961
4.209
+4.209
0.0%
jan 1, 1962
4.188
-0.022
-0.51%
jan 1, 1963
4.165
-0.023
-0.55%
jan 1, 1964
4.143
-0.022
-0.53%
jan 1, 1965
4.125
-0.017
-0.42%
jan 1, 1966
4.114
-0.011
-0.27%
jan 1, 1967
4.11
-0.004
-0.1%
jan 1, 1968
4.112
+0.002
0.04%
jan 1, 1969
4.118
+0.006
0.15%
jan 1, 1970
4.126
+0.008
0.21%
jan 1, 1971
4.136
+0.01
0.24%
jan 1, 1972
4.344
+0.208
5.03%
jan 1, 1973
4.579
+0.234
5.39%
jan 1, 1974
4.826
+0.247
5.4%
jan 1, 1975
5.089
+0.263
5.45%
jan 1, 1976
5.369
+0.28
5.5%
jan 1, 1977
5.666
+0.298
5.55%
jan 1, 1978
5.981
+0.314
5.55%
jan 1, 1979
6.312
+0.332
5.55%
jan 1, 1980
6.66
+0.347
5.5%
jan 1, 1981
7.022
+0.363
5.44%
jan 1, 1982
7.398
+0.376
5.35%
jan 1, 1983
7.791
+0.392
5.3%
jan 1, 1984
8.198
+0.407
5.23%
jan 1, 1985
8.62
+0.422
5.15%
jan 1, 1986
9.055
+0.434
5.04%
jan 1, 1987
9.504
+0.449
4.96%
jan 1, 1988
9.968
+0.465
4.89%
jan 1, 1989
10.455
+0.487
4.88%
jan 1, 1990
10.969
+0.514
4.91%
jan 1, 1991
11.519
+0.55
5.01%
jan 1, 1992
12.109
+0.59
5.12%
jan 1, 1993
12.64
+0.531
4.39%
jan 1, 1994
13.185
+0.545
4.31%
jan 1, 1995
13.758
+0.573
4.34%
jan 1, 1996
14.354
+0.597
4.34%
jan 1, 1997
14.976
+0.622
4.33%
jan 1, 1998
15.623
+0.647
4.32%
jan 1, 1999
16.309
+0.685
4.39%
jan 1, 2000
17.041
+0.733
4.49%
jan 1, 2001
17.832
+0.791
4.64%
jan 1, 2002
18.051
+0.219
1.23%
jan 1, 2003
18.288
+0.237
1.32%
jan 1, 2004
18.546
+0.258
1.41%
jan 1, 2005
18.819
+0.273
1.47%
jan 1, 2006
19.099
+0.28
1.49%
jan 1, 2007
19.388
+0.289
1.52%
jan 1, 2008
19.688
+0.3
1.54%
jan 1, 2009
20.0
+0.312
1.58%
jan 1, 2010
20.323
+0.323
1.62%
jan 1, 2011
20.662
+0.339
1.67%
jan 1, 2012
21.015
+0.354
1.71%
jan 1, 2013
21.384
+0.369
1.75%
jan 1, 2014
21.768
+0.384
1.8%
jan 1, 2015
22.17
+0.401
1.84%
jan 1, 2016
22.541
+0.371
1.67%
Ranking of countries by current statistics by years


Comments: