29
/
en
AIzaSyAYiBZKx7MnpbEhh9jyipgxe19OcubqV5w
April 1, 2024
61108
Sub-Saharan Africa (IDA & IBRD countries)
TSS
false
2
1
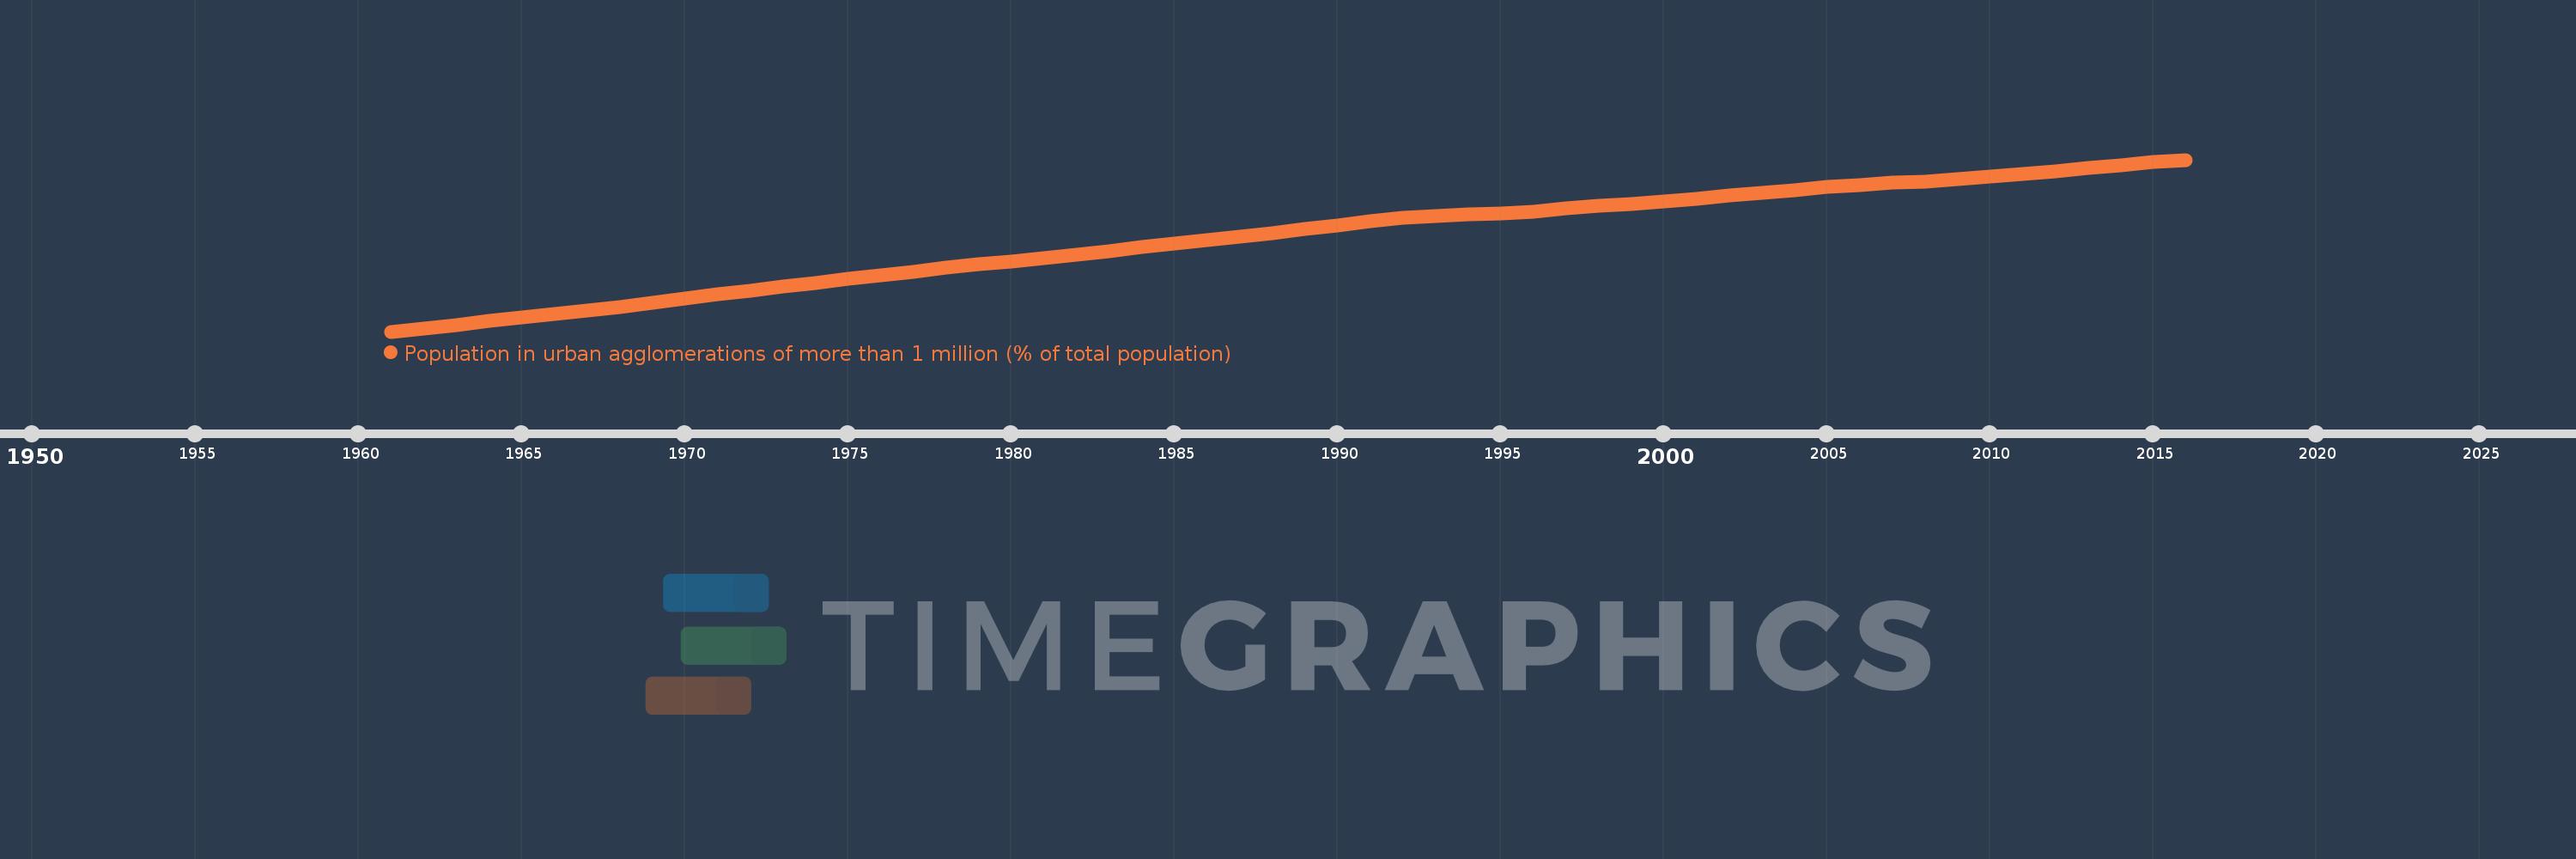
Population in urban agglomerations of more than 1 million (% of total population)
2016,2015,2014,2013,2012,2011,2010,2009,2008,2007,2006,2005,2004,2003,2002,2001,2000,1999,1998,1997,1996,1995,1994,1993,1992,1991,1990,1989,1988,1987,1986,1985,1984,1983,1982,1981,1980,1979,1978,1977,1976,1975,1974,1973,1972,1971,1970,1969,1968,1967,1966,1965,1964,1963,1962,1961
This statistics in other country:
Timeline:
This timeline shows a graph from 1961 to 2016 of Sub-Saharan Africa (IDA & IBRD countries). No data until 1960. Number of actual observations by date: 56.
Source name:
World Development Indicators
Source organization:
United Nations, World Urbanization Prospects.
Categories, topics:
Climate Change, Urban Development
Last updated:
apr 23, 2017
Indicators value changes by year
Maximum:
15.105
jan 1, 2016
At the date of observation
Value
Absolute change
Change from previous value
jan 1, 1961
6.041
+6.041
0.0%
jan 1, 1962
6.218
+0.177
2.93%
jan 1, 1963
6.403
+0.185
2.97%
jan 1, 1964
6.588
+0.185
2.89%
jan 1, 1965
6.77
+0.182
2.77%
jan 1, 1966
6.955
+0.185
2.73%
jan 1, 1967
7.149
+0.195
2.8%
jan 1, 1968
7.355
+0.205
2.87%
jan 1, 1969
7.57
+0.215
2.93%
jan 1, 1970
7.793
+0.223
2.95%
jan 1, 1971
8.008
+0.214
2.75%
jan 1, 1972
8.2
+0.192
2.39%
jan 1, 1973
8.407
+0.208
2.53%
jan 1, 1974
8.612
+0.205
2.44%
jan 1, 1975
8.811
+0.199
2.31%
jan 1, 1976
9.012
+0.201
2.28%
jan 1, 1977
9.206
+0.195
2.16%
jan 1, 1978
9.396
+0.19
2.06%
jan 1, 1979
9.589
+0.193
2.05%
jan 1, 1980
9.756
+0.167
1.74%
jan 1, 1981
9.928
+0.173
1.77%
jan 1, 1982
10.103
+0.174
1.75%
jan 1, 1983
10.284
+0.181
1.79%
jan 1, 1984
10.486
+0.202
1.97%
jan 1, 1985
10.67
+0.184
1.76%
jan 1, 1986
10.856
+0.185
1.74%
jan 1, 1987
11.046
+0.19
1.75%
jan 1, 1988
11.241
+0.195
1.77%
jan 1, 1989
11.442
+0.201
1.78%
jan 1, 1990
11.642
+0.2
1.75%
jan 1, 1991
11.849
+0.207
1.78%
jan 1, 1992
12.051
+0.202
1.7%
jan 1, 1993
12.139
+0.089
0.74%
jan 1, 1994
12.217
+0.078
0.64%
jan 1, 1995
12.285
+0.067
0.55%
jan 1, 1996
12.365
+0.08
0.65%
jan 1, 1997
12.547
+0.182
1.47%
jan 1, 1998
12.668
+0.122
0.97%
jan 1, 1999
12.793
+0.125
0.99%
jan 1, 2000
12.918
+0.124
0.97%
jan 1, 2001
13.059
+0.141
1.09%
jan 1, 2002
13.205
+0.146
1.12%
jan 1, 2003
13.36
+0.155
1.17%
jan 1, 2004
13.506
+0.146
1.1%
jan 1, 2005
13.655
+0.149
1.1%
jan 1, 2006
13.769
+0.115
0.84%
jan 1, 2007
13.892
+0.123
0.89%
jan 1, 2008
13.955
+0.063
0.45%
jan 1, 2009
14.079
+0.124
0.89%
jan 1, 2010
14.218
+0.138
0.98%
jan 1, 2011
14.361
+0.143
1.01%
jan 1, 2012
14.507
+0.147
1.02%
jan 1, 2013
14.659
+0.152
1.05%
jan 1, 2014
14.816
+0.157
1.07%
jan 1, 2015
14.981
+0.165
1.11%
jan 1, 2016
15.105
+0.124
0.83%
Ranking of countries by current statistics by years


Comments: